Silver’s retreat from its 2026 peak has brought the metal back toward a price zone that preceded its explosive rally. Peter Brandt believes the painful decline could carry a message that silver bulls should understand before they dismiss the market completely.
The veteran trader’s argument centres on what happens when committed buyers finally abandon their positions. His accompanying weekly chart provides useful context, although the price action still leaves an important question unanswered: how much further could silver fall before a durable recovery begins?
What you'll learn 👉
Peter Brandt Explains Why Silver’s Selloff Could Help A Bottom Develop
Peter Brandt, through his Factor Report account, described the silver decline as a familiar purge. He said he had encountered similar episodes over 50 years, and linked this example to buyers who entered above $90 to $100.
His observation focused on their apparent change of conviction. Buyers who previously insisted they would never sell were now exiting and declaring that they would never purchase silver again. Brandt described that reversal as a condition associated with the early stages of market bottoms.
The reasoning is straightforward: persistent losses can push even committed holders to sell. Those exits add pressure immediately, but they can eventually reduce the pool of holders desperate to escape.
This process is commonly called capitulation. A market can begin to stabilise once urgent sales diminish and available demand absorbs the remaining supply.
Brandt’s interpretation does not establish that every seller has surrendered. His comments describe investor behaviour as he sees it, and the chart alone cannot verify individual buyers’ entry prices or motives.
Silver Price Chart Shows A Deep Retreat Toward The Previous Breakout Zone
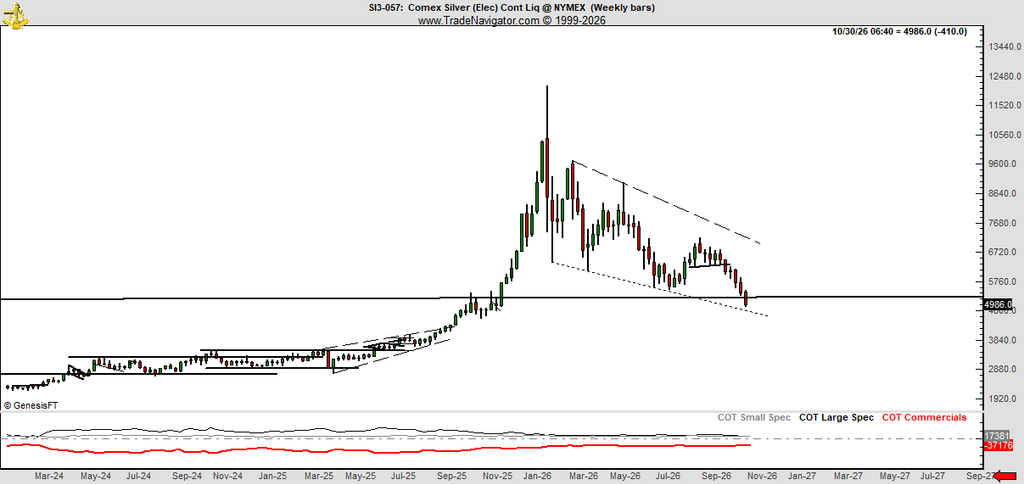
A look at the silver chart shows a weekly COMEX futures series dated October 30, 2026. The displayed reading of 4986.0 corresponds to approximately $49.86 per ounce.
The chart traces a climb from the $20s during 2024 to a peak near $120 early in 2026. Silver then entered a sustained decline, with successive rebounds failing below earlier highs.
That leaves the displayed silver price roughly 58% below its peak. The reversal has erased much of the rapid advance that developed around the beginning of 2026.
The latest red candle also extends below the thick horizontal reference around $52 to $53. This area matters because it overlaps the region silver crossed before its strongest acceleration.
A return toward an earlier breakout zone can test whether buyers still consider that area valuable. However, the latest candle shows continued pressure rather than clear evidence that support has held.
Several chart features deserve closer attention:
- The previous breakout region near $52 to $53 has been breached by the latest candle.
- The lower descending boundary runs around the upper $40s near the current candles.
- The upper descending boundary remains well above price and limits the broader recovery picture.
These are approximate visual references from the supplied chart, rather than precise forecasts from Brandt.
The Descending Pattern Leaves Silver Bulls Without A Confirmed Reversal
The dashed boundaries form a narrowing downward structure that resembles a possible falling wedge. Such formations can precede recoveries, but their presence alone does not confirm an upside breakout.
Silver remains inside that structure near its lower boundary. The sequence of lower rebound highs also remains intact.
A constructive development would involve silver holding near the lower boundary and recovering the lost horizontal reference. A subsequent break above the upper descending boundary would provide stronger evidence that the decline is losing control.
The distinction matters because a brief bounce can occur during an ongoing downtrend. A lasting recovery needs more than an initial reaction from a support area.
Read Also: Binance Hack News: Ethena Transfers $24M in ENA During Reserve Rebuild
What Could Happen Next For Silver Price After The Crash
The bullish scenario begins with silver stabilising around the upper $40s before reclaiming approximately $52 to $53. That would create an early indication that demand can absorb the latest wave of sales.
A neutral outcome would involve several weeks of sideways movement near current levels. This could allow a base to develop, although repeated failures to recover lost support would leave the outcome uncertain.
The bearish scenario involves a sustained break beneath the lower descending boundary. Such a move would weaken the proposed wedge setup and keep lower prices possible.
Brandt’s central point is that extreme disappointment can accompany the beginning of a bottom. The chart still requires evidence that silver can turn that possibility into a recovery.
Subscribe to our YouTube channel for daily crypto updates, market insights, and expert analysis.