
Bitcoin’s selloff after the Binance hack has brought nearby support back into focus, and Ali Charts has identified a deeper level that could matter if the decline continues. His warning comes ahead of the upcoming US midterm elections, another event on the market calendar.
The immediate question is whether BTC can stabilise before that deeper support becomes necessary. Several levels stand between the current pressure and a more serious breakdown, and the response at each could help explain where Bitcoin price goes next.
What you'll learn 👉
Ali Charts Identifies $73,000 As A Key Bitcoin Price Level
Ali Charts named $73,000 as an important reference if Bitcoin faces further sales after the Binance hack and ahead of the US midterm elections. His reasoning centres on Bitcoin’s short term holder cost basis, which he placed approximately around that price.
This metric estimates the average acquisition price of relatively recent BTC holders. It helps assess whether that group collectively holds unrealised profits or losses.
Bitcoin above this reference generally leaves those holders in aggregate profit. A sustained decline below it puts the group underwater, although individual entry prices will vary.
That distinction matters during a selloff because recent buyers may have less tolerance for further losses. Some could exit as pressure increases, but the metric cannot establish how many holders would sell.
IF BITCOIN SELLS OFF, WATCH $73,000 If selling pressure accelerates following the Binance hack and the upcoming US midterm elections, one level to watch is $73,000. That’s approximately where Bitcoin’s short-term holder cost basis currently sits. This metric represents the average acquisition price of relatively recent $BTC buyers, making it an important gauge of market sentiment.
— Ali Charts (@alicharts) October 30, 2026
The $73,000 level therefore provides a useful test of demand. A successful defence would support the case for stabilisation, but the cost basis alone cannot guarantee a bottom.
Bitcoin Price Faces Nearby Support Before A Deeper Test
The Binance breach provides the immediate backdrop to this analysis. Bitcoin dropped below $79,000 during the initial reaction reported by the Associated Press.
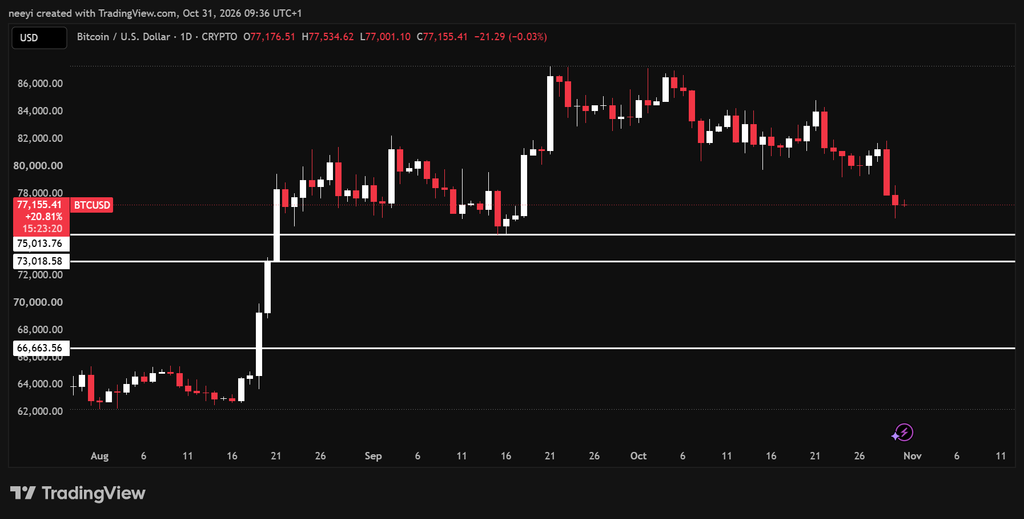
Our technical interpretation places the nearest support around $77,000. A sustained loss of that level would bring approximately $75,000 into focus before the deeper $73,000 reference identified by Ali Charts.
The sequence matters because a decline does not need to pass through every support area without resistance. Demand could return before Bitcoin reaches the lowest level under discussion.
The main references in this analysis are:
- $77,000 provides the nearest support test for Bitcoin price.
- $75,000 marks the next downside reference if that support fails.
- $73,000 becomes more important after a sustained loss of the higher levels.
Confirmation also matters when support comes under pressure. A temporary dip followed by a quick recovery carries a different message from repeated closes below a level and failed attempts to reclaim it.
Read Also: Crypto After the Binance Hack: Analyst Maps BTC, ETH and XRP Buy Zones
The $75,000 To $76,000 Zone Could Support Another Bitcoin Rebound
Our broader view identifies the $75,000 to $76,000 region as an area Bitcoin has repeatedly rebounded from since August. That history makes it an important part of the current support argument.
Another successful defence would keep that pattern intact. It would also reduce the immediate need for a test of Ali Charts’ $73,000 reference.
However, earlier rebounds cannot promise the same outcome during the next decline. The Binance incident has introduced a fresh catalyst, and demand must absorb the supply available during this particular test.
The quality of any recovery would therefore matter. Bitcoin would need to regain lost ground and retain it, rather than produce a brief bounce that sellers quickly reverse.
A Breakdown Below $73,000 Would Strengthen The Deeper Downside Case
The more severe scenario in our analysis begins if Bitcoin loses $73,000 and fails to recover it. That would put price beneath the support sequence discussed above and below the holder cost basis identified by Ali Charts.
Approximately $66,000 would then become a potential downside reference. A further extension toward $60,000 would represent a more aggressive bearish outcome.
These are conditional levels from our interpretation, separate from Ali Charts’ specific cost basis observation. The available analysis does not establish that Bitcoin must reach them or that any decline would happen within a fixed period.
A fast drop would require persistent sales and insufficient demand between those areas. Support failure would increase the risk, but it would not confirm the entire move immediately.
Read Also: XRP Price Crash: Analyst Says Binance Hack Only Accelerated What Was Already Coming
What Could Happen Next As Bitcoin Tests Support
The recovery scenario begins with Bitcoin defending $77,000 or finding demand around $75,000 to $76,000. That would preserve the possibility of another rebound from familiar support.
A neutral outcome could involve repeated tests and uneven recoveries without a decisive breakdown. Such behaviour would leave the broader direction unresolved.
The bearish case becomes stronger if Bitcoin loses the higher support zones and then cannot recover $73,000. Until that sequence develops, the deeper downside levels remain possibilities rather than confirmed destinations.
Subscribe to our YouTube channel for daily crypto updates, market insights, and expert analysis.