
Ethereum has dropped hard over the past few days, and one analyst says the chart was warning about it before the move even began. Traders watching the ETH price now want to know how far this decline can run and which levels matter most. Here is what the analyst and our own indicators are showing.
Ethereum fell after a market catalyst arrived, and the drop matched a forecast shared a day earlier on the More Crypto Online YouTube channel. The analyst said that forecast called for lower prices, with ETH expected to reach a target zone between $1,832 and $2,069. He mentioned Binance as part of the day’s events but said he would cover that topic in a separate video once more data is available.
For now, More Crypto Online chose to focus on what the chart is doing. He also pointed out that the same bearish forecast applied to the Bitcoin chart.
What you'll learn 👉
ETH Price Action Is Following an Elliott Wave Count Closely
According to More Crypto Online, Ethereum is moving inside a steep channel that points straight toward the blue target zone on his chart. He said the speed of the drop fits the wave count he shared before the move happened. The analyst described the current decline as a third wave inside a larger C wave.
Third waves are usually the strongest part of an Elliott Wave pattern, which explains why the drop looks so aggressive. He added that a C wave often reaches the 100% extension of the A wave. That level is measured by taking the length of the A wave and projecting it from the high of the B wave.
These are the levels the analyst shared:
| Level | Range or Price |
|---|---|
| Main support zone | $1,724 to $2,200 |
| Smaller target zone | $1,832 to $2,069 |
| Key swing low | $2,292 |
Earlier Boring Market Phases Also Ended With Sudden Price Moves
More Crypto Online compared the current setup to what happened in July and August. A wave 1 and wave 2 setup appeared to the upside in July, and price pumped in August. This time the same type of setup pointed to the downside, and the analyst said it appeared on the chart the morning before the drop.
He explained that markets often move fast after a long stretch of low activity. In his view, the wave 1 and wave 2 setup is one of the best signals in Elliott Wave analysis because a third wave usually follows. He also said he posted the setup in his member analysis feed before the decline started.
What Could Happen Next: A Wave 4 Bounce or a Deeper Drop Toward $1,800
The analyst named $2,292 as the most important level on the chart. He drew a green breakout line there and said pressure stays down as long as price trades below it. A wave 4 bounce could appear overnight, and he said that bounce may be fairly aggressive.
After that, he expects one more lower low in wave 5 to complete the larger third wave. That move would take ETH into his $1,832 to $2,069 target zone. More Crypto Online does not believe the correction is finished yet. He stressed that this view comes from the chart data and not from personal opinion.
Our Ethereum Price Analysis Shows $2,170 as the Level to Watch
Our own analysis lines up with that bearish picture. The Ethereum price has fallen by around 20% since its September high near $2,800. ETH currently trades near $2,240 after reaching a weekly low of $2,170, and price bounced from that low.
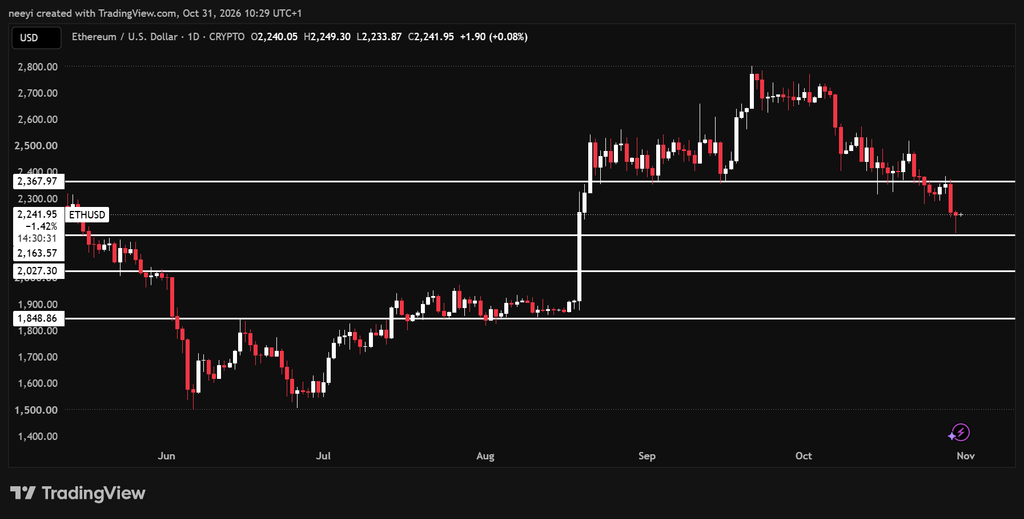
Two outcomes now look possible for the ETH price:
- If $2,170 holds, Ethereum could consolidate between $2,170 and $2,400.
- If $2,170 gives way, a decline toward $2,000 becomes possible.
- A crash from the $2,000 area could take ETH to around $1,800.
Price has declined steadily for more than a month. That trajectory could continue lower and eventually reach levels below $2,000.
Read Also: XRP Price Crash: Analyst Says Binance Hack Only Accelerated What Was Already Coming
Technical Indicators Also Point to Selling Pressure on ETH
The indicators back up the bearish reading on the Ethereum price. Here is how each one currently looks.
| Name | Value | Action |
|---|---|---|
| RSI(14) | 29.888 | Sell |
| MACD(12,26) | -71.478 | Sell |
| Ultimate Oscillator | 47.000 | Sell |
| Bull/Bear Power(13) | -187.7489 | Sell |
The RSI(14) reads 29.888, which is just under the 30 mark that many traders treat as oversold. The reading shows how heavy the selling has been, and the indicator currently gives a sell signal.
The MACD(12,26) reads -71.478. A negative value means the short term average trades below the longer term average, and that points to bearish momentum.
The Ultimate Oscillator reads 47.000 and also gives a sell signal. This reading is much closer to neutral than the RSI, so it shows weaker selling pressure than the other tools.
The Bull/Bear Power(13) indicator reads -187.7489, the largest negative number in the group. That tells us bears currently control the market and buyers are struggling to push ETH higher.
Subscribe to our YouTube channel for daily crypto updates, market insights, and expert analysis.