XRP price is back at a support zone that has already attracted buyers several times, and analyst CasiTrades is watching the reaction closely.
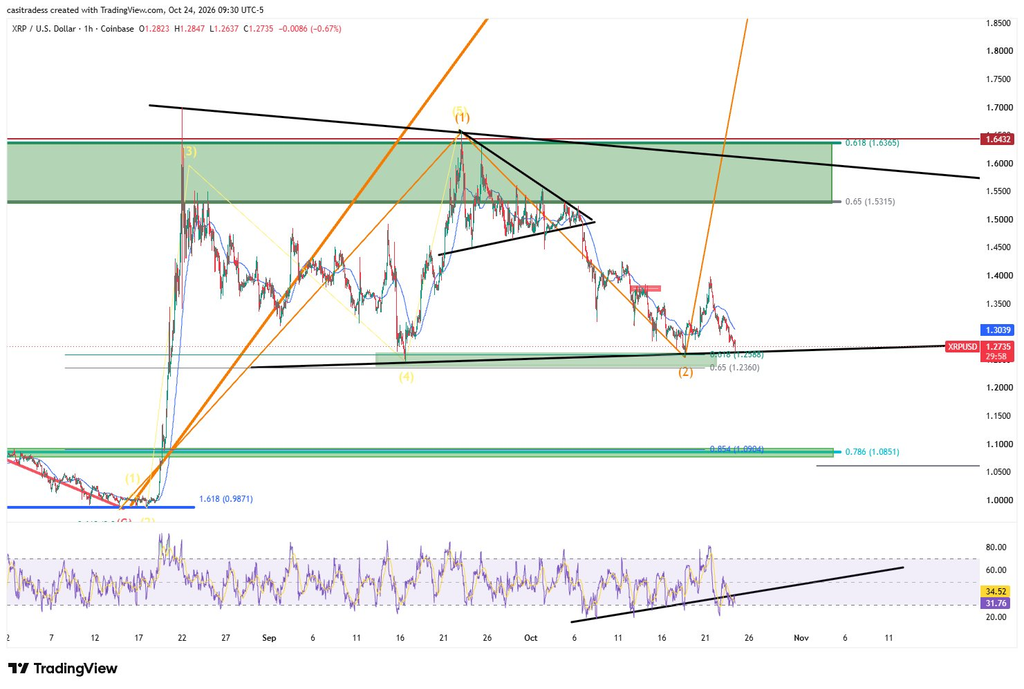
“XRP gets ANOTHER test of support,” she wrote alongside a new one-hour Coinbase chart.
We cover CasiTrades fairly often because her setups usually give clear levels, defined support zones and an obvious point where the bullish idea stops working. This one is no different.
XRP is trading around $1.27, almost directly on top of the support region she has been tracking.
What you'll learn 👉
CasiTrades’ XRP Chart Puts $1.26 at the Center
The first level on the chart is the 0.618 Fibonacci retracement around $1.2588.
That is where XRP is testing support now.
Just below it, the chart shows another level around $1.2360.
The important detail is that this area also lines up with a rising support line that has been forming since the August lows.
So XRP is not testing one random price.
It is testing a cluster of technical support around $1.24-$1.26.
The chart also shows RSI near 31.8, with its average around 34.5. Momentum is therefore weak and close to oversold conditions.
CasiTrades also draws an upward-sloping RSI trendline beneath recent lows. If RSI keeps respecting that structure as price holds $1.26, it would add weight to the idea that sellers are losing control.
What Happens If XRP Holds?
The upside levels are clearly marked.
The first area I would watch is around $1.30-$1.31.
Above that, the XRP price would need to reclaim roughly $1.35-$1.38 before the short-term structure starts looking healthier.
The larger resistance zone on CasiTrades’ chart sits between approximately $1.53 and $1.64.
That region includes:
- 0.65 level near $1.5315
- 0.618 level near $1.6365
- horizontal resistance around $1.6432
That is the area bulls would eventually need to break before talking about a much larger trend reversal.
The chart also shows a descending trendline coming directly through that zone, so $1.53-$1.64 is not an easy target.
My XRP Price Outlook
My interpretation is that XRP still has a chance to bounce, but the current support needs to hold first.
If $1.258-$1.26 survives, I would look for $1.30 first, then $1.35-$1.38.
A stronger recovery could eventually bring $1.50-$1.53 back into focus.
If $1.258 fails, however, $1.236 becomes the next level.
Below that, the chart contains a much deeper support zone around $1.09-$1.085.
| Scenario | XRP price path |
|---|---|
| Bullish | Hold $1.26 → $1.30 → $1.35-$1.38 |
| Stronger recovery | Break $1.38 → $1.50-$1.53 |
| Bearish | Lose $1.258 → $1.236 |
| Deeper downside | Lose $1.236 → $1.09-$1.085 |
For me, the key point is simple.
XRP is not yet bouncing.
It is testing the level from which a bounce could begin.
That makes the next reaction around $1.24-$1.26 far more important than trying to predict a large upside target too early.
For more crypto news and price predictions, click here.
Subscribe to our YouTube channel for daily crypto updates, market insights, and expert analysis.