
Gold and silver prices are entering October 22 without a clear directional advantage.
Gold spent much of the latest session hovering near the low-$4,100s after several failed recovery attempts, with spot prices around $4,125-$4,150. The metal remains well below the levels that controlled trading earlier this month, but sellers have also struggled to force a decisive move beneath $4,100.
Silver is near $57.56. After plunging into the mid-$55 area last week, XAG/USD has stabilized, but the rebound has become increasingly choppy. The latest four-hour chart shows silver essentially trapped around $57-$58 rather than starting a convincing recovery.
One note: the two chart uploads appear to show the same silver chart, so I am not going to invent fresh gold indicator readings that are not visible. The gold technical section therefore focuses on the current price structure and recent levels.
What you'll learn 👉
Gold Price: $4,100 Is Becoming a Familiar Battleground
Gold’s recent behavior has become repetitive.
Drops toward roughly $4,080-$4,100 keep attracting buyers, yet rallies toward $4,160-$4,200 continue losing strength.
That creates a compressed market where neither side has produced confirmation.
For October 22, I would divide the chart into three zones.
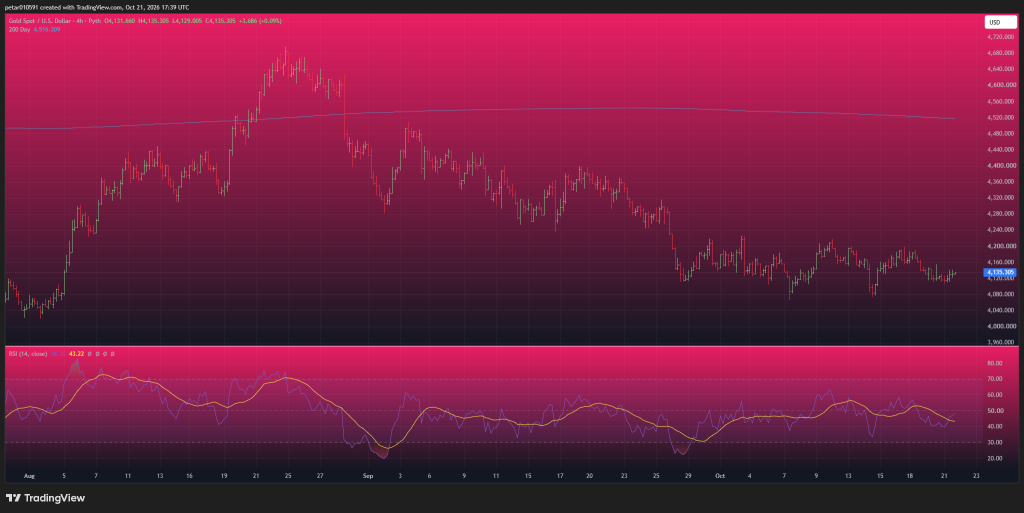
The first is $4,100-$4,080. This remains the area bulls need to protect. A clean loss would expose approximately $4,040, followed by the psychological $4,000 level.
The second is roughly $4,150-$4,180. Gold needs to get through this region simply to regain short-term momentum.
Then comes the harder ceiling at $4,200-$4,220. Repeated failures there have kept the recovery from developing into something stronger.
What I do not like from a bullish perspective is that every recent bounce has struggled to produce sustained follow-through. At the same time, bears have had several opportunities to push gold decisively below $4,100 and have failed.
That leaves gold in a genuine decision area.
Read also: Time to Buy Gold? Gold Price Crash May Be Near Its Limit
Silver Price: Buyers Have Stabilized XAG, but Not Reversed the Trend
Silver’s four-hour chart looks slightly different.
XAG/USD is around $57.56 after its violent decline from the upper-$60s and the eventual low around $55-$56.
Since that low, the silver price has stopped making aggressive new lows. Instead, the market has settled into a narrow range around $57-$58.
That stabilization is constructive, but the broader structure remains damaged.
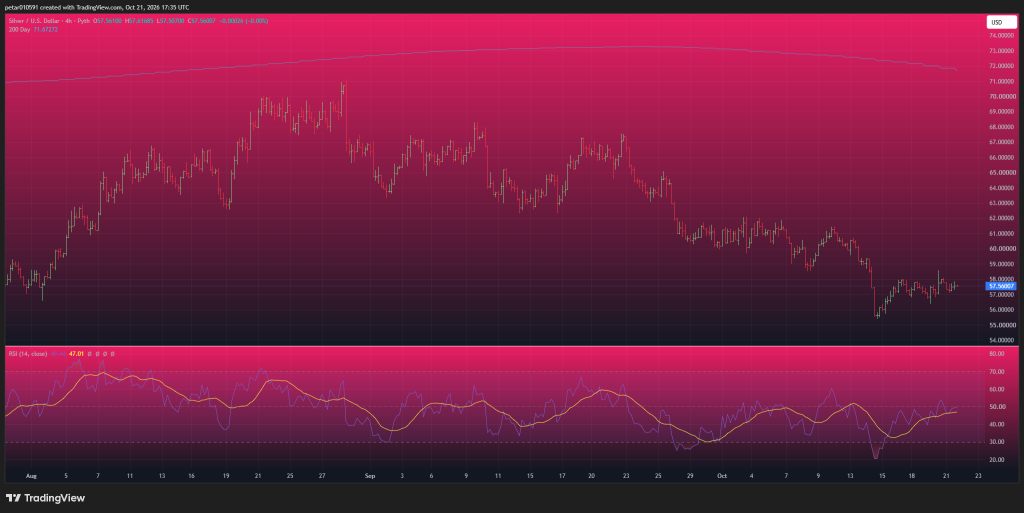
The latest RSI reading is approximately 49.4, with its average around 47.0. Momentum is therefore almost perfectly neutral.
This is important because silver is no longer deeply oversold. The easy technical bounce from extremely weak momentum has already happened.
Now buyers need actual price progress.
The first obstacle is around $58. If that breaks, $59 becomes more interesting, followed by $60-$61.
Below price, I would keep $57 as the first line of defense.
A break underneath $56.50 would put the recent $55-$55.50 bottom back under pressure.
Silver also remains dramatically below its 200-day average near $71.63, showing just how far the current market is from repairing the larger trend.
Macro News Could Make October 22 More Volatile
The Federal Reserve remains the biggest macro variable.
The next FOMC meeting takes place on October 27-28. Markets broadly expect policymakers to keep rates unchanged this month, but expectations for another increase later in the year remain elevated because inflation is still proving difficult to control.
Oil is especially relevant right now.
Brent recently moved back above roughly $108 as optimism around U.S.-Iran diplomacy weakened. Expensive energy can feed inflation expectations, which in turn keeps pressure on the Fed to maintain restrictive policy. That is an awkward combination for gold and silver: inflation can increase demand for hard assets, but the resulting rise in rate expectations can simultaneously hurt non-yielding metals.
Treasury yields have provided some relief. The U.S. 10-year yield recently eased toward approximately 5.12%, helped partly by weak housing data. September housing starts fell 5.2%, and pending home sales also deteriorated. Softer economic data can help metals if it reduces expectations for prolonged tightening.
October 22 also brings fresh U.S. data, including weekly jobless claims, the Conference Board Leading Economic Index and the Kansas City Fed manufacturing survey. Any meaningful downside surprise could push yields lower, whereas strong numbers could reinforce the higher-for-longer rate narrative. Kiplinger
Gold and Silver Price Predictions for October 22
I would not expect either metal to produce a clean directional move without first escaping its current range.
| Metal | Bullish path | Base-case zone | Bearish path |
|---|---|---|---|
| Gold | Reclaim $4,160-$4,180 → $4,200-$4,220 | $4,090-$4,180 | Lose $4,080 → $4,040, then $4,000 |
| Silver | Break $58 → $59-$60 | $56.80-$58.20 | Lose $56.50 → $55.50-$55 |
For gold, I lean neutral with a slight bearish bias below $4,160. The repeated defense of $4,100 is encouraging, but buyers have done very little with those rebounds.
Silver looks marginally more interesting because price has stopped accelerating lower and RSI has returned to neutral territory. But $58 needs to fall before I would call the bounce convincing.
The two prices I would watch most closely on October 22 are therefore $4,100 for gold and $57 for silver.
Above those levels, both metals still have room to rebuild.
For more financial news and price predictions, click here.
Subscribe to our YouTube channel for daily crypto updates, market insights, and expert analysis.