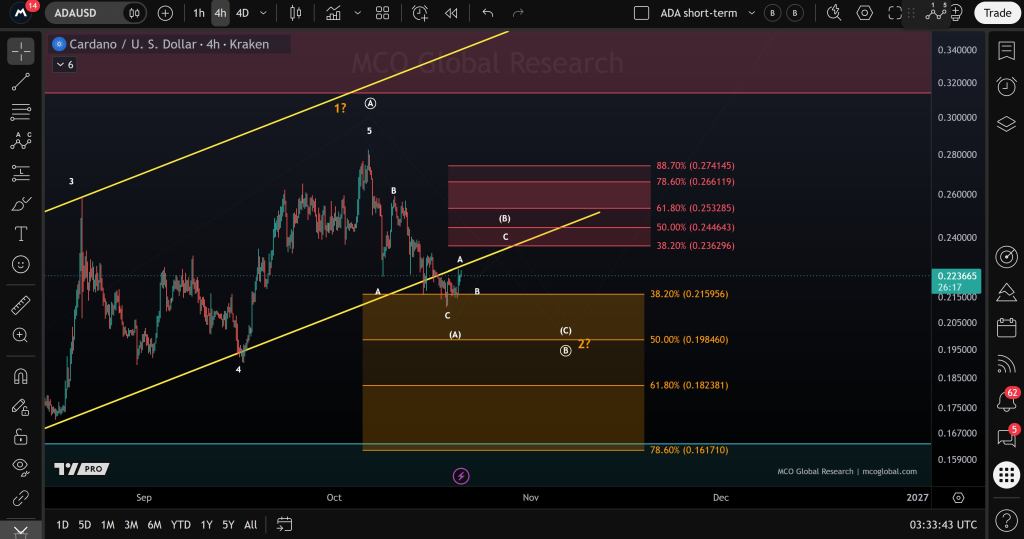
Cardano price is attempting to recover after another difficult stretch for ADA, with price trading around $0.224 on the four-hour Kraken chart shared by More Crypto Online.
The analyst says ADA is “trying to start a bounce from this region in wave (B),” and his Elliott Wave chart provides a fairly detailed roadmap for what that recovery could look like.
The important point is that he is not necessarily calling the final bottom. The bounce he is tracking appears to be part of a larger corrective structure, which means the ADA price could move higher first and still face another decline afterward.
What you'll learn 👉
Cardano Is Reacting From $0.216 Support
The first important level on the ADA chart is $0.215956, which corresponds with the 38.2% Fibonacci retracement of the larger move.
ADA recently traded into that region and has since recovered toward $0.224.
That reaction is significant because the same area also intersects with the lower boundary of the previous rising structure.
More Crypto Online labels the recent move into the zone as wave A of a potentially larger correction, followed by the developing wave B bounce.
If that interpretation is correct, buyers now need to prove that this recovery has enough strength to move beyond a small reaction from support.
The chart gives us several upside levels to measure that.
Where Could the ADA Price Bounce Go?
The first larger resistance area begins around $0.2363.
Above that, the Fibonacci ladder becomes:
- $0.2363 at 38.2%
- $0.2446 at 50%
- $0.2533 at 61.8%
- $0.2661 at 78.6%
- $0.2741 at 88.7%
I would consider $0.236-$0.245 the first realistic recovery zone.
From the current price around $0.224, reaching $0.245 would mean roughly 9% upside.
If wave B becomes stronger, $0.253-$0.266 becomes much more interesting. A move to $0.266 would equal approximately 19% upside.
The top of the analyst’s recovery zone is around $0.274, close to the early-October peak.
But that is not yet the base case simply because the bounce has started.
ADA first needs to clear $0.236 and then prove it can hold above $0.245.
Read also: ChatGPT Predicts if Cardano Price Can Reach $1 in 2027
Why This May Still Be Only a Corrective Bounce
This is the part I would be careful with.
More Crypto Online’s chart still leaves open a considerably deeper correction.
The orange Fibonacci zone below current price contains:
- $0.215956
- $0.198460
- $0.182381
- $0.161710
The chart appears to allow for a wave C decline after the current B-wave recovery.
That means a rally toward $0.24-$0.26 would not necessarily mean Cardano has entered a new bullish trend.
It could simply be the middle part of an A-B-C correction.
If ADA fails to sustain the bounce and falls beneath $0.216 again, $0.198 becomes the next serious level.
Below $0.198, the chart exposes approximately $0.182, with $0.162 representing the deeper 78.6% retracement.
My Take on the Cardano Setup
I think this is one of the more useful ways to look at ADA right now because it does not force a bullish conclusion just because price bounced.
The immediate setup has improved.
ADA defended the $0.216 region and is now trying to build higher. If $0.236 breaks, I would take the move more seriously and start looking toward $0.245-$0.253.
But I would not call Cardano’s correction finished yet.
The broader structure is still damaged after ADA dropped from roughly $0.275 toward $0.21, and More Crypto Online’s own Elliott Wave count leaves room for another leg lower after the current bounce.
For now, I would frame the roadmap like this:
$0.216 holds → $0.236 → $0.245 → potentially $0.253-$0.266.
If $0.216 fails again:
$0.198 → $0.182 → potentially $0.162.
So the Cardano price bounce is real enough to watch, but the next few resistance levels will tell us whether buyers are actually taking control or whether ADA is simply experiencing a temporary Wave B recovery before another move lower.
For more crypto news and price predictions, click here.
Subscribe to our YouTube channel for daily crypto updates, market insights, and expert analysis.