Traders often try to catch the next move before a recovery becomes obvious. The advantage comes from identifying a setup with clear support, realistic targets, and a level that tells you when the analysis has failed.
Cardano and Kaspa offer an interesting comparison because their price structures and indicators point in different directions. ADA has returned to a familiar support area, but its indicators remain weak. KAS has stronger indicator readings, although its recovery faces several obstacles.
That difference is important when deciding which chart offers the clearer bounce opportunity.
What you'll learn 👉
Cardano Price Returns to Support After Repeated Channel Recoveries
The supplied Cardano price analysis describes an ascending channel that has guided ADA since June. Price has repeatedly recovered from the lower boundary and met resistance near the upper boundary.
Previous rebounds started around $0.15 in July, $0.17 in August, and $0.19 in September. Those progressively higher support levels explain why the current area around $0.21 deserves attention.
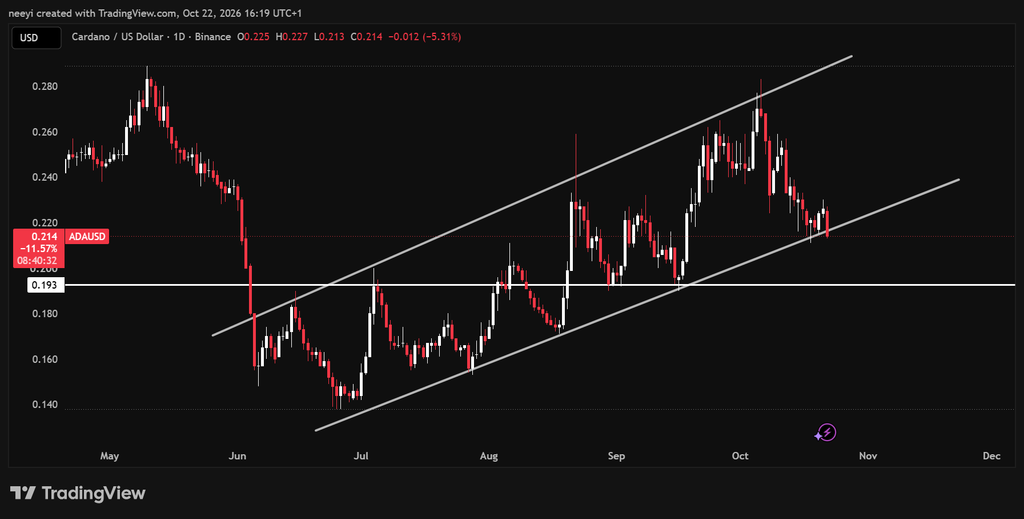
ADA has returned to the channel floor again. Another successful defense would preserve the pattern of higher lows and create room for a recovery toward the upper boundary above $0.283.
A move from $0.21 to $0.283 would represent approximately 35%. However, the channel provides a potential route rather than a guaranteed destination. Buyers still need to defend support and establish a sustained rebound.
Failure around $0.21 would weaken the immediate setup. The previous low around $0.19 would become the next important test. A recovery there could preserve a broader rebound opportunity, although the current channel setup would require reassessment.
Cardano Indicators Show Weak Momentum Despite The Bounce Opportunity
Cardano’s indicators explain why support alone cannot confirm that a recovery has started.
| Indicator | Reading | What The Reading Means |
| RSI (14) | 38.003 | Momentum favors sellers below the midpoint, although ADA has not reached the conventional oversold threshold. |
| Stochastic (9,6) | 8.861 | The deeply oversold reading creates bounce potential, but weakness can persist without confirmation. |
| MACD (12,26) | −0.002 | The negative reading supports a cautious view of the immediate recovery attempt. |
| Ultimate Oscillator | 40.078 | Buying pressure remains relatively weak below the midpoint. |
| Bull/Bear Power (13) | −0.0086 | Sellers retain the advantage relative to the indicator’s reference average. |
The Stochastic reading offers the clearest reason to watch for a rebound. However, an oversold reading does not establish a price floor.
RSI recovery toward 50 and improvements in MACD would strengthen the bullish case. Until those changes develop, Cardano’s appeal rests mainly on its support structure.
The indicator timeframe was not supplied, so these readings cannot establish exactly how quickly a bounce might develop.
Cardano’s Year End Outlook Includes A Specific Leios Delivery Test
Cardano’s development schedule provides another factor to monitor before December. Input Output Global submitted a proposal for 27.7 million ADA to advance Ouroboros Leios toward a mainnet ready release candidate by late 2026. That milestone concerns release readiness, which differs from a completed mainnet launch.
The price relevance depends on delivery. Verifiable progress toward that milestone could strengthen confidence in Cardano’s capacity expansion plans. Delays could weaken that argument, particularly if ADA also loses channel support.
Development progress would therefore complement the chart setup. It would not automatically produce the projected 35% recovery.
Kaspa Price Faces Several Resistance Levels After Its Channel Breakdown
Kaspa’s price structure presents a more difficult recovery route. KAS broke below its ascending channel around October 10 to October 13, then recovered during the following week.
That rebound has failed to clear resistance around $0.039. Price near $0.037 now places the next support around $0.034 back in focus.
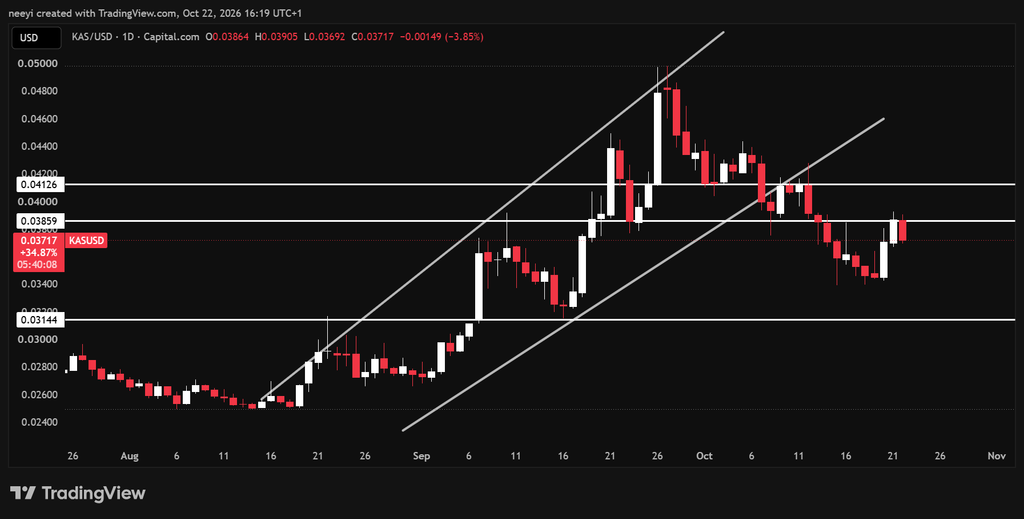
A decline to $0.034 would equal approximately 8%. Failure there could expose $0.031, approximately 16% below $0.037.
The bullish route requires several separate victories:
- KAS must first reclaim resistance around $0.039.
- A sustained move above $0.041 would clear another recovery obstacle.
- Price must then challenge the former channel floor near $0.044.
The move toward $0.044 offers approximately 19% upside from $0.037. However, the former channel floor could become resistance after the breakdown. Reaching that area would represent an important repair attempt rather than automatic confirmation of a restored uptrend.
Kaspa Indicators Favor Recovery Despite The Damaged Price Structure
Kaspa’s indicator readings are healthier than Cardano’s, although the strength remains modest.
| Indicator | Reading | What The Reading Means |
| RSI (14) | 52.448 | Momentum holds slightly above the midpoint without a strong bullish advantage. |
| Stochastic (9,6) | 45.335 | The neutral reading leaves room for movement in either direction. |
| MACD (12,26) | 0.001 | The positive reading supports recovery potential, but its small size calls for confirmation. |
| Ultimate Oscillator | 58.043 | Buying pressure has a moderate advantage above the midpoint. |
| Bull/Bear Power (13) | 0.0001 | Buyers hold only a marginal advantage near the zero line. |
These readings support a recovery attempt, but price still needs to overcome $0.039. Positive indicators beneath unresolved resistance can accompany a temporary rebound within a weaker structure.
Kaspa’s Year End Catalysts Depend On Applications And Development Progress
Kaspa’s Toccata upgrade activated on June 30, 2026. Its live capabilities include covenants and zero knowledge verification, which expand what developers can construct on the network. However, official documentation describes the broader vProgs application framework as under construction.
The distinction matters for KAS before year end. Usable applications and dependable developer tools would provide stronger evidence of progress than expectations alone. Delays in turning these capabilities into practical products could limit that argument.
Kaspa also identifies DAGKnight as the consensus upgrade after Toccata. The cited roadmap does not establish a firm activation date, so treating it as a guaranteed catalyst before December would overstate the evidence.
Cardano Has The Clearer Recovery Setup Despite Kaspa’s Stronger Indicators
Cardano currently offers the cleaner structural bounce opportunity within the supplied analysis. ADA remains near support inside its ascending channel, with approximately 35% potential toward $0.283.
Kaspa wins the indicator comparison, but its price must reclaim several resistance levels after a channel breakdown. That creates more obstacles before a convincing recovery takes hold.
The next test is straightforward: can ADA defend its familiar support, and can KAS translate healthier indicators into a breakout above $0.039?
FAQs
Subscribe to our YouTube channel for daily crypto updates, market insights, and expert analysis.