
XRP price is trading around $1.33, and analyst XForceGlobal has published one of the more interesting Elliott Wave setups I have seen for the token recently.
His thesis is conditional but clear: if the recent low really marked the bottom of XRP’s correction, the next larger impulse could eventually carry the XRP price toward $3.
“The scenario that would bring us up to $3 for the first impulse if the bottom is in,” XForceGlobal wrote, explaining that the count attempts to incorporate XRP’s internal wave structure without forcing the setup.
That last part is important. This is not simply a straight arrow from $1.37 to $3. The chart maps several waves, pullbacks and confirmation points before XRP gets anywhere near that target.
What you'll learn 👉
XRP May Have Completed a Larger Correction
The eight-hour Coinbase chart shows a lengthy decline from XRP’s previous highs near 3.60-3.70.
That correction eventually took XRP toward roughly $1, where XForceGlobal labels what may be the completion of a larger corrective structure.
From there, XRP produced a strong initial recovery toward approximately 1.60-1.65.
That move is labeled Wave 1.
The latest pullback then brought XRP back into an important retracement region between the 50% and 61.8% Fibonacci levels.
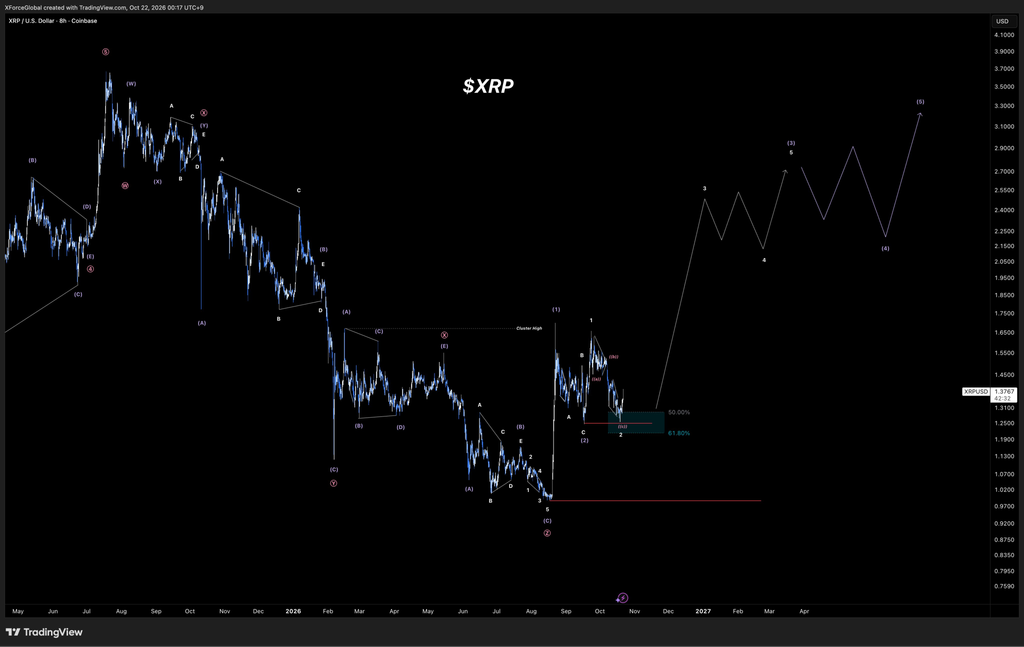
Visually, that zone appears to sit roughly around 1.25-1.31.
XRP has already reacted from this area and is now trading near $1.37.
That is the core of the analyst’s setup.
If Wave 1 really ended around $1.60 and the latest decline was Wave 2, XRP could now be preparing for Wave 3, which is normally the strongest part of a five-wave Elliott Wave advance.
Read also: This XRP Price Prediction Maps a 5-Step Road to $1,000
The 1.25-1.30 Area Is Critical
I think this is the most important part of the chart.
The analyst is not assuming XRP has bottomed merely because price bounced.
His bullish count depends on the retracement zone holding.
XRP has already tested the area around the 50%-61.8% retracement, and buyers have responded. As long as price continues respecting roughly 1.25-1.30, the potential Wave 2 bottom remains credible.
If XRP starts losing that area decisively, however, the bullish count becomes much harder to defend.
There is also a red horizontal line near $1, representing the deeper structural low.
A return all the way there would effectively tell us that the current bullish interpretation was premature.
So I would frame the structure as:
1.25-1.30 holds → bullish count remains alive.
Lose that area → risk of a deeper correction increases significantly.
XRP Price Forecast: Why $3 Is Not the First Target
The most interesting part of XForceGlobal’s projection is how XRP could travel toward $3.
His chart does not show one continuous vertical move.
Instead, it maps a standard five-wave sequence.
Wave 3 appears to target approximately 2.50-2.70.
That would already be a huge move from $1.37, representing roughly 82%-97% upside.
The chart then anticipates a Wave 4 pullback into approximately 2.10-2.25.
Only after that correction does the projected Wave 5 advance toward approximately 3.20-3.30.
This is why I like the analysis more than many extreme XRP forecasts.
There is an actual structure behind the target.
It acknowledges that even if XRP enters a new bullish impulse, price will almost certainly experience pullbacks along the way.
The First Confirmation Comes Much Earlier
I would not focus on $3 yet.
XRP still has several important levels to reclaim before that target deserves serious attention.
The first is around $1.50.
Above that, the recent cluster high around 1.60-1.65 becomes extremely important.
A convincing break above that region would establish a higher high relative to the first recovery wave and provide much stronger evidence that XRP has moved out of its correction.
Then I would start looking toward roughly 1.80-2.00.
Only after XRP establishes itself above $2 would the analyst’s larger 2.50-3 scenario start becoming much more relevant.
From the current $1.37 area, the rough roadmap would therefore look like this:
| Stage | XRP area | Why is it important |
| Support | 1.25-1.30 | Potential Wave 2 bottom |
| First recovery | $1.50 | Short-term structure improves |
| Confirmation | 1.60-1.65 | Break of recent cluster high |
| Expansion | 2.00-2.50 | Potential Wave 3 development |
| Wave 3 target | ~2.60-2.70 | Larger impulse objective |
| Wave 4 pullback | ~2.10-2.25 | Expected corrective phase |
| Wave 5 target | ~3.00-3.30 | Analyst’s larger bullish objective |
My Take on XForceGlobal’s XRP Price Prediction
I think this is a strong technical framework, but the phrase “if the bottom is in” should remain front and center.
The $3 target is not confirmed today.
What we have today is a potential Wave 2 bottom around an important Fibonacci retracement zone.
That is enough to make the setup interesting, not enough to declare a new XRP bull trend.
For me, 1.60-1.65 is the level that changes the conversation.
If XRP eventually breaks above that area and holds it, I would take the larger bullish impulse much more seriously.
Until then, 1.25-1.30 remains the area that protects the thesis.
So the XForceGlobal scenario is certainly bullish, but it is also surprisingly disciplined: defend the retracement, break the recent high, then allow the five-wave structure to develop.
If that sequence plays out, a move toward $3 is not as unrealistic as it initially sounds.
For more crypto news and price predictions, click here.
Subscribe to our YouTube channel for daily crypto updates, market insights, and expert analysis.