
EUR/USD remains under pressure on the four-hour chart, but trader FX_Momentum_pips believes the pair may be entering an area where a short-term recovery can develop.
His TradingView analysis combines Smart Money Concepts, supply and demand zones, liquidity, Fair Value Gaps and traditional market structure. The broader trend is still bearish, with EUR/USD falling from the 1.17 region toward roughly 1.12 and repeatedly forming lower highs and lower lows.
What makes the current area interesting is the reaction around 1.11728. Price has already tested liquidity around the recent lows and is attempting to stabilize, but the analyst is not treating that reaction as a confirmed reversal yet.
What you'll learn 👉
EUR/USD Is Still Trading Inside a Bearish Structure
The decline began after EUR/USD failed around the upper supply regions near 1.16516-1.17000.
From there, the chart shows a fairly consistent bearish sequence. Recovery attempts produced lower highs, supply zones repeatedly attracted sellers, and price eventually broke below the former demand area around 1.135-1.137.
That old support is now above the market and could become resistance during any recovery.
The descending trendline reinforces the same structure. Until EUR/USD can break above that line and reclaim a recent lower high, the broader four-hour setup continues to favor sellers.
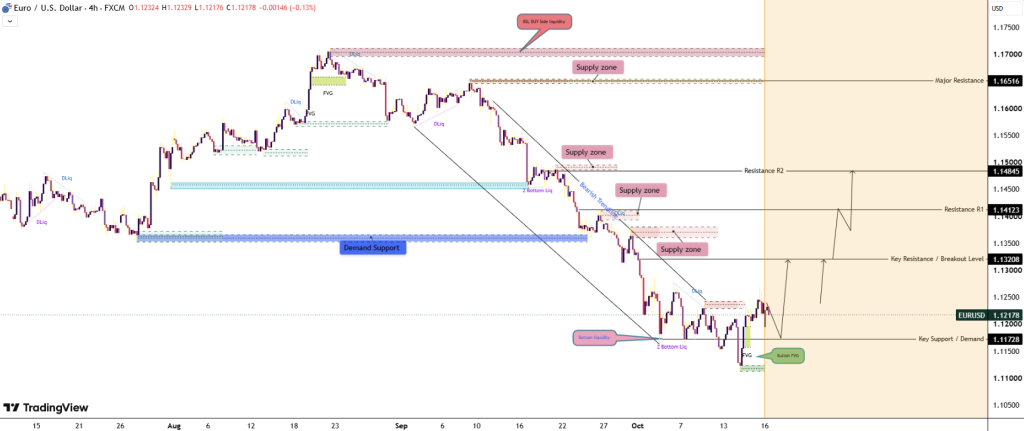
The trader also maps several supply zones above current price. These matter because even if EUR/USD starts recovering, buyers would have to work through multiple areas where sellers previously entered.
Liquidity Around 1.117 Could Trigger a Short-Term Reversal
The most interesting part of the chart, in my view, is what has happened near the lows.
FX_Momentum_pips identifies bottom liquidity around the recent troughs, with 1.11728 acting as the main nearby support and demand reference.
Price has already pushed beneath previous lows at different points, creating the possibility that sell-side liquidity has been taken.
There is also a bullish Fair Value Gap just beneath the recent structure. If price revisits that imbalance and quickly recovers, it could add weight to the recovery scenario.
But a liquidity sweep by itself is not enough.
I would want to see bullish candles follow the reaction, a break of the descending trendline and then a move above the nearest lower high. Without that sequence, EUR/USD could simply continue consolidating before another decline.
Read also: EUR/USD Price Prediction: Analyst Warns Bearish Structure Could Push Euro Toward…
EUR/USD Price Prediction: Levels to Watch Next
The first level that can materially improve the short-term structure is 1.13208.
FX_Momentum_pips labels this as the key resistance and breakout area. A sustained move above it, ideally followed by a successful retest, would make a recovery more credible.
From there, the chart gives a clear ladder of upside levels:
| EUR/USD level | Role |
|---|---|
| 1.11728 | Key support / demand |
| 1.13208 | Breakout resistance |
| 1.14123 | Resistance R1 |
| 1.14841 | Resistance R2 |
| 1.16516 | Higher-timeframe resistance |
| ~1.17000 | Upper supply / buy-side liquidity |
If 1.11728 holds and EUR/USD breaks the nearby bearish structure, I would first watch 1.13208.
A clean move above that level could open 1.14123, followed by 1.14841.
The larger recovery target would be around 1.16516, but getting there would require a much more substantial change in four-hour structure.
The bearish case is simpler.
If EUR/USD closes decisively below 1.11728 and cannot reclaim it, the current stabilization attempt would lose credibility and lower demand zones could come back into focus.
So despite the recovery arrows drawn on the chart, this is not yet a bullish EUR/USD setup. It is a bearish market approaching support, with a possible reversal developing only if buyers can prove themselves above 1.13208.
Subscribe to our YouTube channel for daily crypto updates, market insights, and expert analysis.