Silver is trading around $57 after a steep decline from the January 29 all-time high near $121.50, and the current level may be one of the most important areas on the long-term chart.
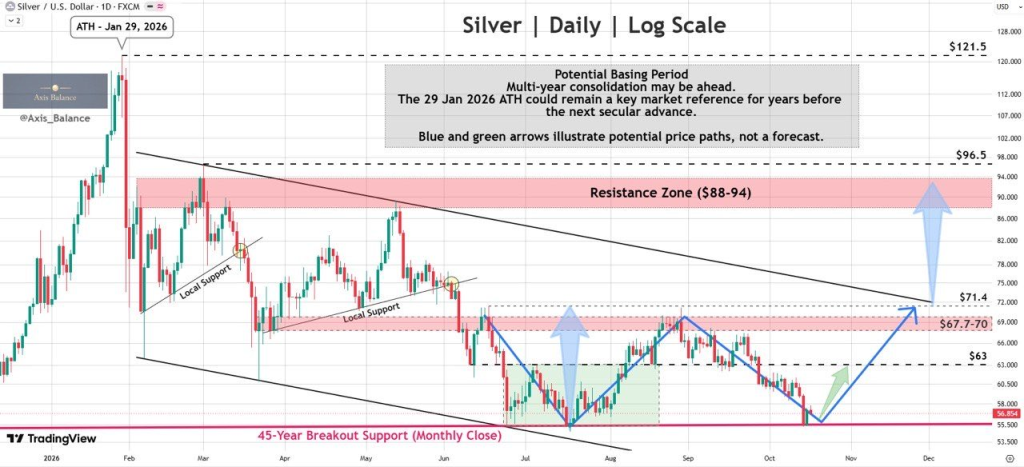
Axis Balance, a smaller analyst account on X, recently shared a high-level daily logarithmic chart that frames the latest move as a retest of a breakout line dating back roughly 45 years.
I think the most interesting part of the setup is that this is not just another short-term support call. His thesis depends heavily on whether the silver price can hold this area on a monthly closing basis.
What you'll learn 👉
Silver Is Sitting on a Long-Term Decision Zone
Axis Balance said his previous roadmap pointed first to $63 and then to the 45-year breakout line.
Silver has now reached that lower target area near $56.85.
His chart treats this zone as the support that could determine whether the larger bullish structure remains valid.
If silver holds it, the current decline can still be viewed as part of the “handle” of a much larger cup formation rather than a complete failure of the long-term trend.
The first recovery level is $63.
Above that, the analyst marks $67.7-$70 as the next important resistance area, followed by roughly $71.4.
The chart then shows a much larger resistance zone between approximately $88 and $94.
I would not jump straight to those higher levels yet. The immediate task for silver is simply to defend the current area and begin recovering former support.
The January high near $121.50 remains the long-term reference, but Axis Balance is careful not to present it as an immediate target. His chart specifically allows for a multi-year basing period before another larger advance.
That makes the setup more measured than many long-term silver forecasts.
What Would Invalidate the Bullish Structure?
The biggest warning is the monthly close.
Axis Balance argues that if silver closes a month below the 45-year breakout line, the old support could start acting as resistance instead.
That would weaken the larger cup-and-handle interpretation considerably.
So the structure I would watch is fairly simple:
- Hold around $56 and begin recovering
- Reclaim $63
- Push toward $67.7-$70
- Lose the breakout line on a monthly basis and the long-term setup becomes much weaker
This is why I think the current level is more important than whether silver moves one or two dollars higher over the next few sessions.
Read also: Gold and Silver Price Predictions for This Week (October 19-25)
Macro News This Week to Affect Silver Price
The technical setup is important, but macro conditions are still difficult.
Hotter U.S. inflation recently pushed Treasury yields and the dollar higher, which has been a problem for precious metals. September CPI came in at 3.7% year over year, strengthening expectations that the Federal Reserve could keep policy tighter for longer.
Silver also behaves differently from gold because it has a much larger industrial component.
That means concerns around economic growth, manufacturing demand and risk appetite can hurt silver even when safe-haven demand is helping gold.
This week, I would keep an eye on Treasury yields, the U.S. dollar and any change in Fed expectations.
If yields cool and the dollar weakens at the same time silver continues defending the $55-$57 area, the recovery toward $63 becomes much more realistic.
If macro pressure stays elevated and silver loses this long-term support on a monthly basis, the chart would look considerably less constructive.
For now, the next real test is whether silver can prove that this 45-year breakout line is still support.
For more financial news and price predictions, click here.
Subscribe to our YouTube channel for daily crypto updates, market insights, and expert analysis.