
XRP’s latest decline has put its bullish monthly outlook through another uncomfortable test. The selloff described in the supplied market update followed the CPI release, but Protechtor believes the bigger question goes beyond the immediate damage. His analysis examines whether XRP’s broader cycle can survive another period of heavy selling.
The current data places XRP’s decline at more than 6% since yesterday’s crash, with a low near $2.316. That puts the immediate focus on further downside. However, the analysts discussed here are examining different timeframes, and their forecasts need careful separation before they can offer a useful picture.
What you'll learn 👉
XRP Price Monthly Cycle Analysis Leaves Room For Further Upside
Protechtor’s argument starts with XRP’s monthly price history instead of its latest daily decline. He identifies recurring upward and downward phases since 2020, with those cycles generally lasting between 12 and 14 months.
His interpretation places XRP in month 3 of a fresh cycle. Should that pattern continue, he expects the next downward phase to begin around July 2027. Until then, his broader expectation favors higher highs and higher lows.
A look at the XRP chart shows alternating green and red shaded periods that illustrate those phases. The earlier sections include measurements of 13 and 14 monthly bars, followed by several periods covering approximately 12 months.
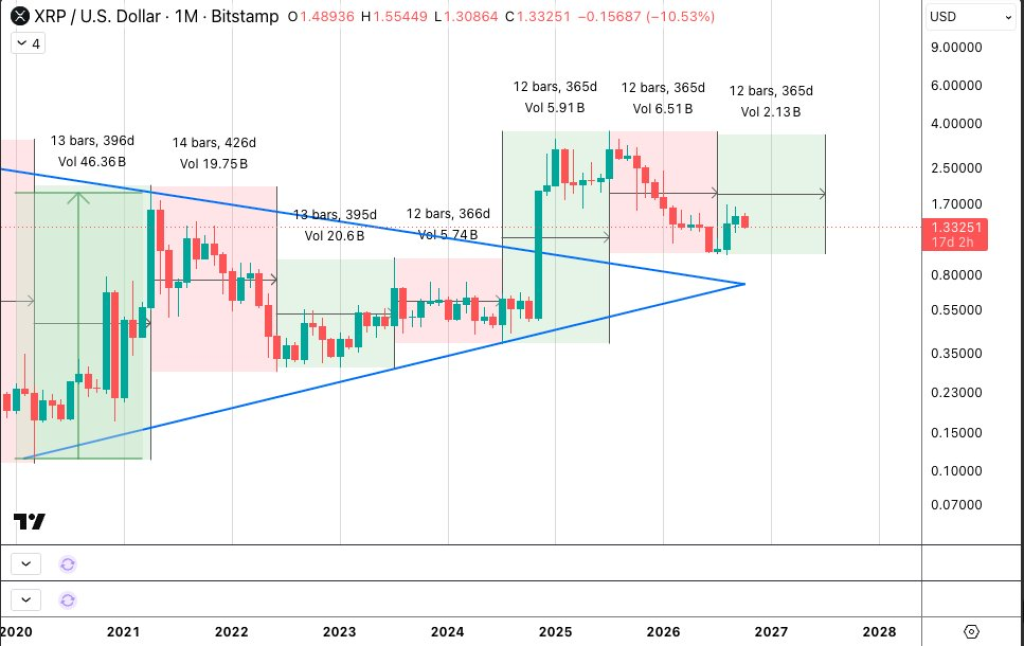
The latest green shaded area extends toward 2027 and illustrates the cycle Protechtor expects. However, that projected area contains unfinished price history, so its placement cannot confirm how future monthly candles will develop.
A rising cycle does not require uninterrupted monthly gains. XRP can finish individual months lower and still preserve an upward structure across a longer period.
Protechtor explicitly allows for red monthly candles within his bullish interpretation. The latest crash therefore does not automatically cancel his thesis, although it creates another test that the monthly price action must pass.
XRP Price Must Preserve Its Structure Beyond The Cycle Calendar
The most useful part of Protechtor’s commentary is his reminder that price ultimately determines whether the pattern remains valid. July 2027 represents a possible timing window under his model, not a guaranteed turning point.
Each monthly candle covers an entire month of activity. A sudden daily decline can look dramatic on a shorter timeframe but form only part of a much larger monthly candle.
The distinction comes down to what happens after the selloff. A recovery followed by a higher monthly low would fit the bullish interpretation more comfortably. Persistent declines and failed recoveries would make that interpretation harder to defend.
Several developments would help assess the monthly thesis:
- Higher monthly lows would support Protechtor’s broader bullish interpretation.
- Fresh monthly highs would provide stronger evidence of continued upside.
- Repeated lower lows would weaken confidence in the proposed cycle.
The supplied commentary does not identify an exact monthly price level that invalidates the model. That limits how precisely the current crash can be measured against his forecast.
Historical repetition offers a framework for observation, but the number of comparable cycles since 2020 remains limited. XRP still needs to produce the price behavior that Protechtor expects.
Ali Charts Maps A Separate XRP Price Rebound Scenario
Ali Charts examines a much shorter timeframe through an hourly parallel channel. His analysis places the lower boundary around $1.25, the middle near $1.42, and the upper boundary near $1.60.
A parallel channel marks price movement between roughly parallel boundaries. The lower boundary can become an area where demand returns, but a touch alone does not confirm a rebound.
Ali’s scenario allows XRP to decline toward $1.25 before a meaningful recovery develops. A successful bounce could then bring $1.42 into focus, followed by $1.60 if the recovery continues.
Those levels describe a conditional sequence:
- XRP first needs to hold the proposed lower boundary near $1.25.
- A sustained rebound could bring the channel midpoint near $1.42 into view.
- Further strength could open a test near the upper boundary at $1.60.
However, these figures do not match the supplied market snapshot near $2.316. The attached monthly chart also displays XRP near $1.33, which confirms that the materials contain different price snapshots.
Ali’s analysis therefore needs its original publication date and chart context before those boundaries can be treated as current support and resistance. A target below the supplied current price cannot sensibly be presented as an immediate upside objective.
Remi Relief Connects XRP Expectations To Institutional Developments
The Real Remi Relief takes a different route through the discussion. His commentary focuses on the remaining October calendar, DTCC developments, and Evernorth’s activity.
His calendar argument is straightforward: October contains 31 days, so a decline during the month does not determine the final monthly result. That observation leaves room for a recovery, although it provides no independent evidence that a recovery must happen.
🚨2 Important XRP Factors To Help You Not Worry and To Chill Instead🚨 1) Uptober has 31 days…just reading the comments lets me know unfortunately there’s no hope for some in this space. We still have a few weeks. The DTCC goes live soon and they need price appreciation on XRP XLM LINK, etc. How high? I’m not sure. It depends on how far they go on day 1. Is it full steam ahead or will they just dip their toes in? 2) This drop was orchestrated in my opinion. Using the CPI data as the excuse. If the price of XRP went up with Evernorth going live I’m pretty sure many people would come out and say “you see, we told you XRP is a security”. It would have given ppl like Elizabeth Warren an excuse to hold crypto back. I know it doesn’t seem like it but the price drop in XRP is for our own good. It puts the plan in motion to get the senate to pass the Clarity Act without any more bologna. Also think about it this way…as I always say, if they can manipulate the price down, they can surely manipulate it up 🤙
— The Real Remi Relief 🙏✝️💪 (@RemiReliefX) October 15, 2026
Remi also argues that institutional developments could benefit XRP, XLM, and LINK. His post connects those expectations to DTCC activity, but it does not establish a required price increase for any of those assets.
His institutional argument contains several uncertainties:
- The scale of any initial rollout would affect its practical market relevance.
- Actual XRP demand would need evidence beyond expectations about institutional participation.
- XRP, XLM, and LINK would each require separate analysis of their involvement.
Institutional participation can support a market narrative, but announcements alone cannot establish how much XRP must be purchased or when those purchases might occur.
Read Also: Asian Market BLOODBATH: Why Are Asian Stocks Crashing?
XRP Crash Claims Need Evidence Beyond Political Explanations
Remi’s more controversial argument describes the decline as deliberately arranged and potentially helpful to the CLARITY Act’s progress. He also connects that interpretation to Evernorth and possible political criticism of XRP.
Those statements remain his personal explanation. The supplied post provides no transaction evidence or documented coordination to establish that the crash was engineered.
A decline following CPI news also does not prove that inflation data served as an excuse for manipulation. Timing can identify a possible catalyst, but it cannot establish hidden intent.
FAQs
Subscribe to our YouTube channel for daily crypto updates, market insights, and expert analysis.