Ethereum, XRP and Solana are testing whether their latest declines can give way to a recovery today. Yesterday’s losses brought all 3 assets close to important price levels, and their next moves could depend on how buyers respond around those areas.
The crypto price prediction for today, October 8, comes down to whether support holds and resistance starts to give way. The indicator readings remain weak across ETH, XRP and SOL, although their recovery paths differ. Here is what those readings and price levels could mean for today’s trading.
What you'll learn 👉
Ethereum Price Tests Support After Yesterday’s Decline
Ethereum fell more than 5% yesterday and reached a low around $2,530. ETH has since recovered to approximately $2,570, but that bounce still leaves the price inside the $2,530 to $2,630 range.
A look at the Ethereum price levels shows $2,530 as the immediate support to monitor. Buyers need to defend that area to keep the current recovery intact. A move toward $2,630 would retrace part of yesterday’s decline, although Ethereum would still need to clear resistance there.
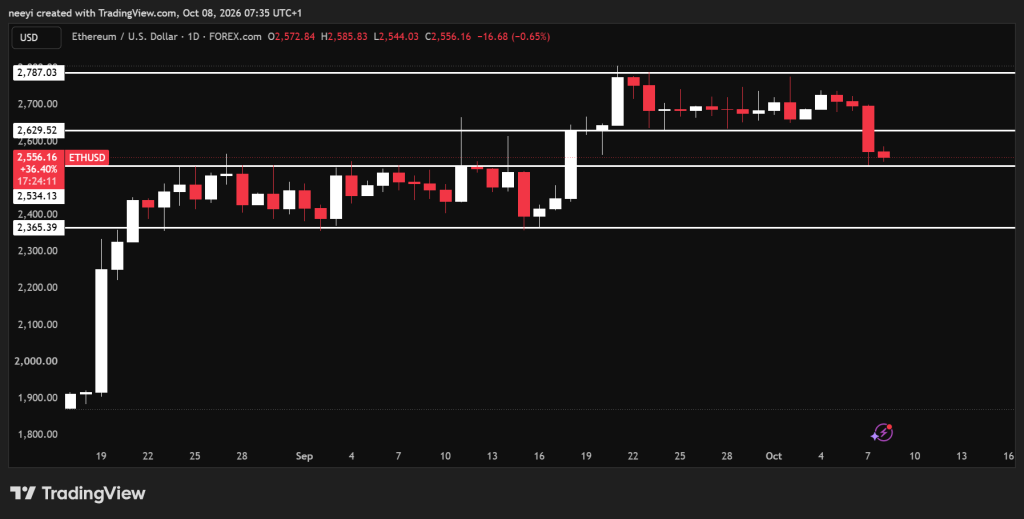
Failure to hold $2,530 would weaken the recovery case and bring $2,360 into focus. Conversely, a sustained break above $2,630 could open a path toward $2,780. These are conditional targets, and the readings alone cannot establish whether ETH will reach them today.
Ethereum Indicators Show Weak Momentum Despite The Bounce
Ethereum’s RSI of 32.582 remains below the midpoint of 50 and close to the usual oversold threshold of 30. This means recent losses still dominate the momentum reading. The brief recovery has not established stronger buying pressure.
The MACD reading of −34.559 also points to bearish momentum. However, the supplied value does not include the signal line or histogram, so it cannot confirm whether a bullish crossover is developing.
The Ultimate Oscillator at 31.097 places momentum near the lower end of its scale. Buying pressure remains weak across the periods measured, although the reading is slightly above the usual oversold threshold.
The Bull/Bear Power reading of −110.3633 adds evidence of downside pressure. Its negative value supports caution about the bounce, but it does not provide a price target.
| Indicator | Value | What The Reading Means |
|---|---|---|
| RSI (14) | 32.582 | Momentum remains weak and close to oversold territory. |
| MACD (12,26) | −34.559 | Bearish momentum persists; crossover details are unavailable. |
| Ultimate Oscillator | 31.097 | Buying pressure remains limited across the measured periods. |
| Bull/Bear Power (13) | −110.3633 | The negative reading supports continued downside pressure. |
Ethereum Price Prediction For Today
- Bullish scenario: ETH holds $2,530 and clears $2,630, which could bring $2,780 into reach.
- Neutral scenario: Ethereum continues trading between $2,530 and $2,630 as the recovery loses speed near resistance.
- Bearish scenario: A sustained break below $2,530 could expose Ethereum price to another decline toward $2,360.
XRP Price Recovery Depends On Defending The Recent Low
XRP followed a similar downward path yesterday and now trades around $1.40 after a recent low near $1.389. The immediate question is whether that low can hold through another test.
A recovery from this area could take XRP price toward $1.45, followed by $1.48. Buyers would need to clear both resistance levels before a return to $1.50 becomes more convincing.
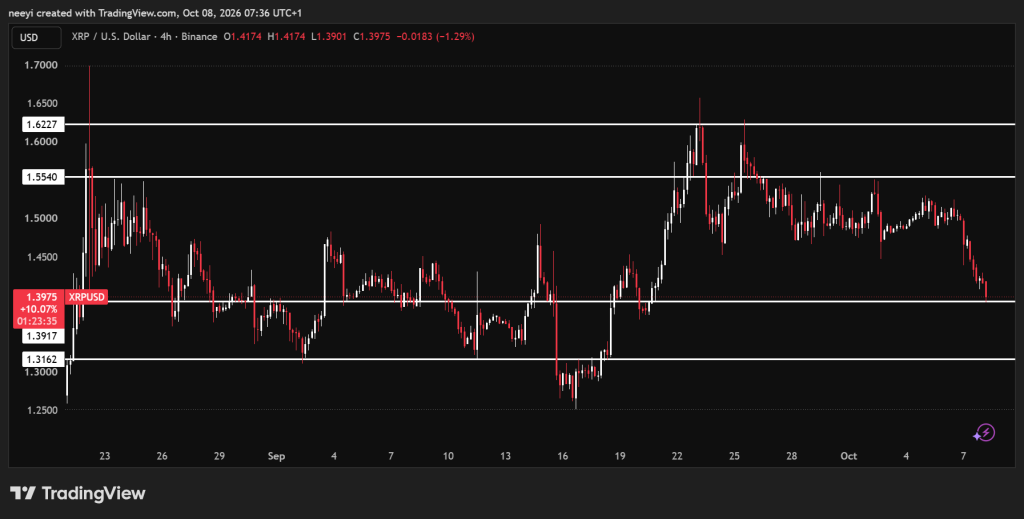
The distinction between $1.389 and $1.38 matters here. The recent low provides the first reference point, and $1.38 marks the broader support boundary in this outlook. A sustained loss of that boundary could bring $1.34 into focus.
XRP Indicators Show Oversold Conditions Without Confirming A Reversal
XRP’s RSI of 29.653 falls below the usual oversold threshold of 30. This indicates strong recent selling pressure and leaves room for a relief bounce. Oversold conditions, however, do not guarantee that the decline has finished.
The MACD reading of −0.022 remains negative and supports a bearish momentum outlook. A recovery toward $1.45 would be more convincing if momentum also improved, although the supplied data cannot establish a crossover.
The Ultimate Oscillator at 31.914 remains close to oversold territory. Its position indicates weak buying pressure across its measured periods, even though it has not fallen below 30.
The Bull/Bear Power reading of −0.0920 reinforces the weak picture. The negative reading means the current bounce still needs stronger price confirmation before it can support a broader recovery case.
| Indicator | Value | What The Reading Means |
|---|---|---|
| RSI (14) | 29.653 | XRP is oversold, but a reversal remains unconfirmed. |
| MACD (12,26) | −0.022 | Negative momentum continues to weigh on the recovery. |
| Ultimate Oscillator | 31.914 | Buying pressure remains weak and close to oversold levels. |
| Bull/Bear Power (13) | −0.0920 | Downside pressure remains evident despite the brief recovery. |
XRP Price Prediction For Today
- Bullish scenario: XRP defends $1.389 and breaks through $1.45 and $1.48, which could allow a test of $1.50.
- Neutral scenario: XRP price makes a modest recovery but remains within the broader $1.38 to $1.50 range.
- Bearish scenario: A sustained break below $1.38 could clear the path toward support around $1.34.
Solana Price Faces Resistance At Its Former Support
Solana broke below support around $116 and is now testing that area as resistance. This makes the recovery attempt especially important because SOL needs to reclaim the level it recently lost.
Continued rejection around $116 could send Solana price toward $112. Failure to defend $112 would then bring $106 into focus.
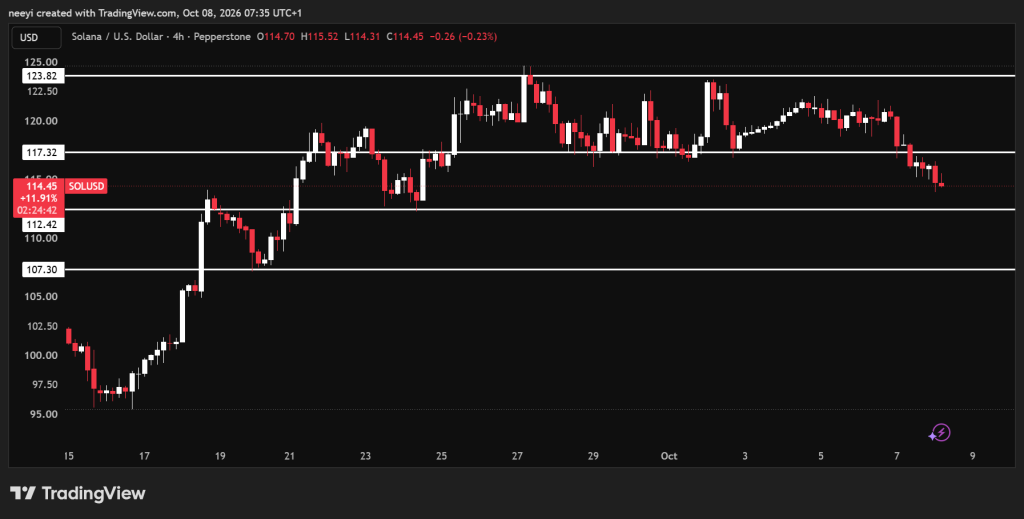
A sustained recovery above the $117 zone would improve the outlook and could allow a move toward $121. Further strength could put $124 within reach, although each resistance level needs confirmation through price action.
Solana Indicators Keep The Recovery Under Pressure
Solana’s RSI of 32.769 remains close to oversold territory and below 50. Recent losses still dominate momentum despite the attempt to recover former support.
The MACD reading of −1.055 supports the bearish picture. The negative value shows weak momentum, but the missing signal line prevents a reliable crossover assessment.
Read Also: UFC Star Says He Is a Proud “Hard” Bitcoin Holder
The Ultimate Oscillator at 34.320 indicates limited buying pressure across its measured periods. It remains above 30, so the reading does not meet the usual oversold threshold.
The Bull/Bear Power reading of −5.3300 adds further evidence of downside pressure. SOL reclaiming $117 would provide stronger recovery evidence than this reading alone.
| Indicator | Value | What The Reading Means |
|---|---|---|
| RSI (14) | 32.769 | Momentum remains weak and near oversold territory. |
| MACD (12,26) | −1.055 | Bearish momentum continues through the resistance test. |
| Ultimate Oscillator | 34.320 | Buying pressure remains limited across the measured periods. |
| Bull/Bear Power (13) | −5.3300 | The negative reading supports continued downside pressure. |
Solana Price Prediction For Today
- Bullish scenario: SOL reclaims $117 and holds above it, which could support a recovery toward $121 and then $124.
- Neutral scenario: Solana holds $112 but struggles around $116 to $117, which could keep the price within that range.
- Bearish scenario: Rejection at resistance leads to a loss of $112, which could expose Solana price to $106.
FAQs
Subscribe to our YouTube channel for daily crypto updates, market insights, and expert analysis.