Crypto Price Predictions for Today, September 28: Bitcoin (BTC), XRP and Ethereum (ETH)


The crypto market is down 1.22% to $2.86 trillion in 24 hours as leverage flushes and profit-taking weigh on overheated altcoins.
The Bitcoin price is also facing macro pressure after President Trump did not rule out further strikes on Iran before the November midterms, as prediction markets put the odds of another Fed rate hike in October at about 64%–65%.
Also, Bitcoin and Ethereum ETFs recorded strong weekly inflows, showing that institutional demand has not disappeared despite the latest weakness. With the September 30 PCE report approaching, here is where the Bitcoin price, XRP price and Ethereum price could trade today.
What you'll learn 👉
Bitcoin Price Tests $83,000 Support as Bearish Momentum Builds
We had a look at the chart, and the BTC price is trading around $83,149, down 1.55%, after failing to hold the $84,000–$85,000 area. The chart shows resistance around $84,800–$85,000, followed by the recent high near $86,000, as $83,000 is the immediate support and $81,500–$82,000 becomes the next downside zone.
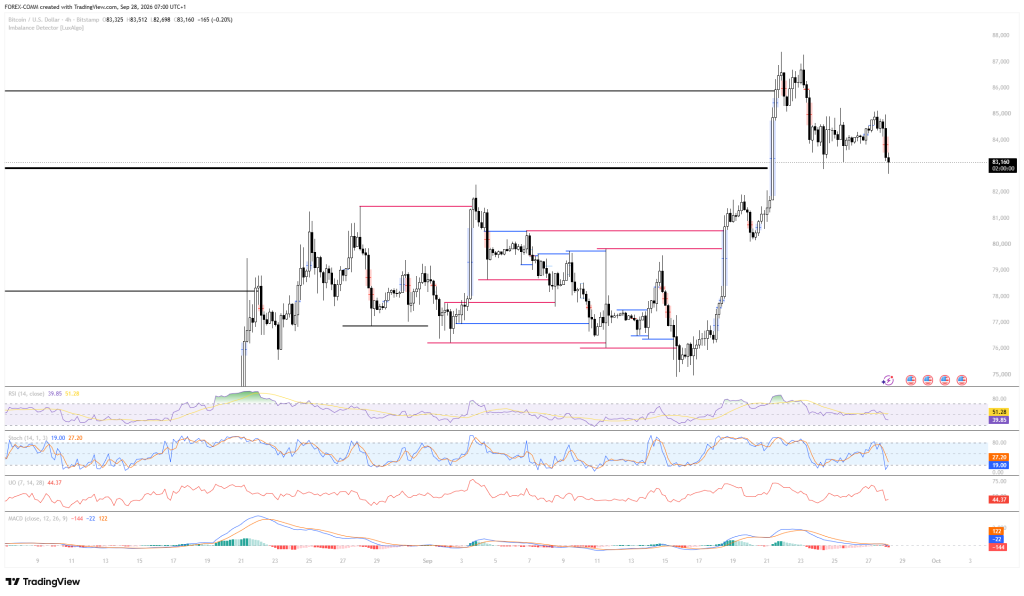
A sustained move below $83,000 would weaken the structure further, specially after the recent rejection from the upper $80,000 area..
The indicators also point to weaker short-term momentum, with RSI at 39.77, STOCH at 18.54, Ultimate Oscillator at 44.21, and MACD at -23. STOCH is already near oversold territory, which leaves room for a technical bounce, but the negative MACD and sub-40 RSI show that sellers still have control.
| Indicator | Reading | Signal |
|---|---|---|
| RSI | 39.77 | Bearish |
| STOCH | 18.54 | Oversold |
| Ultimate Oscillator | 44.21 | Bearish |
| MACD | -23 | Bearish |
Key Factors Pushing the Bitcoin Price Presently
U.S. spot Bitcoin ETFs attracted about $2.4 billion between September 21 and 25, their strongest weekly inflow since October 2025, pushing 2026 net flows back into positive territory and taking ETF assets to roughly $111 billion.
However, daily inflows have slowed and capital is also rotating toward Ether and Solana ETFs, raising the question of whether the large weekly inflow can continue. Sustained ETF demand would provide spot support for the Bitcoin price, but weaker daily flows could limit the recovery.
Macro pressure is also weighing on the Bitcoin price, with Trump leaving open the possibility of more Iran strikes before the midterms and prediction markets pricing a roughly 64%–65% chance of an October Fed rate hike.
Bitcoin liquidations also jumped 391.59% to $51.32 million, mostly from long positions, after BTC failed to reclaim 84,800–85,000, with the 7-day SMA near $83,822 now an important level. The September 30 PCE inflation report is the next major macro event that could influence expectations for the Fed and broader risk assets.
Kazakhstan is considering the use of excess associated gas from oil fields to generate electricity for Bitcoin mining, giving miners another potential energy source and a way to use gas that would otherwise be flared.
The proposal remains preliminary, with no confirmed deployment timeline or regulatory approval. If implemented, the projects could expand mining infrastructure and network hashrate, but the immediate effect on the Bitcoin price should remain limited.
Bitcoin Price Prediction for Today
Bullish Prediction:
Reclaiming $84,800 could send the Bitcoin price toward $86,000.
Neutral Prediction:
BTC could remain between $82,000 and $84,800.
Bearish Prediction:
Losing $82,000 could expose the Bitcoin price to the $80,000–$81,500 area.
XRP Price Drops Toward $1.45 as Bearish Momentum Takes Control
We had a look at the chart, and Ripple’s XRP price is trading at $1.48, down 2.18%, after failing to hold the $1.55 area. The chart shows resistance around $1.55, with the recent rally high near $1.65, as $1.45 is the first support and the $1.35–$1.40 zone becomes important if selling continues.
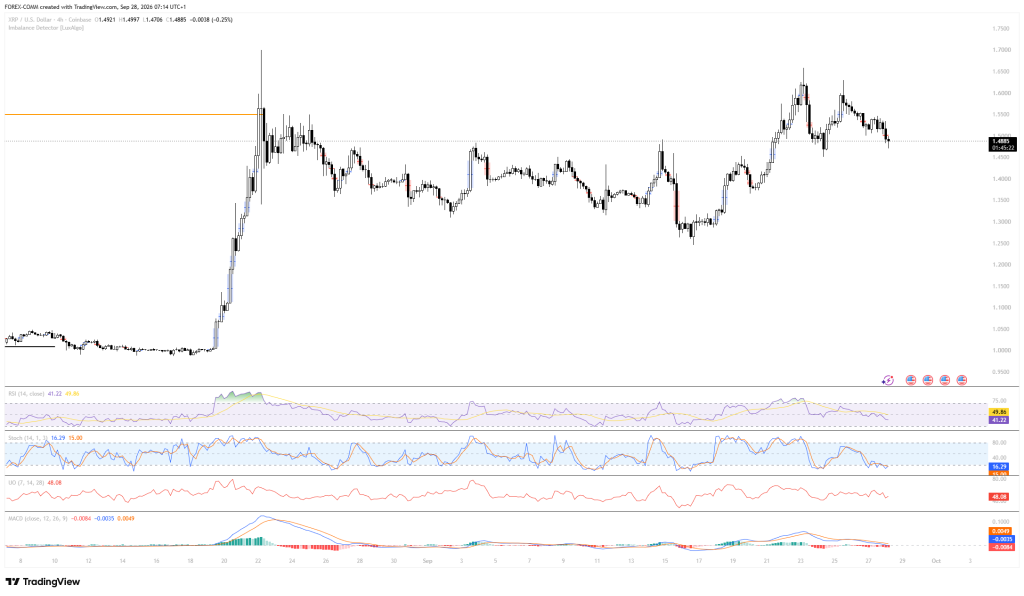
A break below $1.45 would put the recent recovery under more pressure, although the low STOCH reading leaves room for a short-term bounce.
The indicators are weak, with RSI at 41.35, STOCH at 17.11, Ultimate Oscillator at 48.28, and MACD at -0.0036. STOCH is deep in oversold territory, but the RSI below 50 and negative MACD show that the XRP price has not regained bullish momentum.
| Indicator | Indicator | Signal |
|---|---|---|
| RSI | 41.35 | Bearish |
| STOCH | 17.11 | Oversold |
| Ultimate Oscillator | 48.28 | Neutral/Bearish |
| MACD | -0.0036 | Bearish |
Key Factors Pushing the XRP Price Presently
Bitget suffered a major breach involving about 103 million XRP, with roughly $387.5 million in total crypto moved to attacker-controlled wallets.
Around $83 million worth of the stolen XRP was moved on September 27, while a separate 577.8 million XRP transfer from Uphold coincided with lower reported exchange reserves. These movements raise concerns around potential liquidation, withdrawal delays and cross-chain security, although user account balances were reported intact.
The broader crypto market also declined over the past 24 hours, with total market capitalization falling about 1.05% to $2.86 trillion. Macro pressure from heightened U.S.-Iran tensions and the 10-year Treasury yield above 5.2% has weighed on risk assets, with XRP moving alongside Bitcoin during the broader sell-off. This means the latest weakness in the XRP price is linked to both market-wide deleveraging and XRP-specific security concerns.
The movement of stolen XRP remains another source of short-term uncertainty because further transfers or eventual selling could increase available supply. The roughly $83 million movement on September 27 has renewed concerns about potential selling pressure even as XRP continues to have positive fundamental developments, including sustained ETF demand. Traders will therefore be watching exchange balances and wallet movements alongside the $1.45 support.
Related Ethereum News: Here’s Where Bitcoin and Ethereum Prices Might Go This Week
XRP Price Prediction for Today
Bullish Prediction:
A move above $1.55 could put the XRP price back toward $1.60.
Neutral Prediction:
Ripple’s XRP price could remain between $1.45 and $1.55.
Bearish Prediction:
A break below $1.45 could expose the XRP price to 1.40–1.35.
Ethereum Price Holds $2,652 as ETF Demand Counters Macro Pressure
We had a look at the chart, and the ETH price is trading at $2,652.39, with the chart showing a cooling period after the move toward the $2,750–$2,800 region.
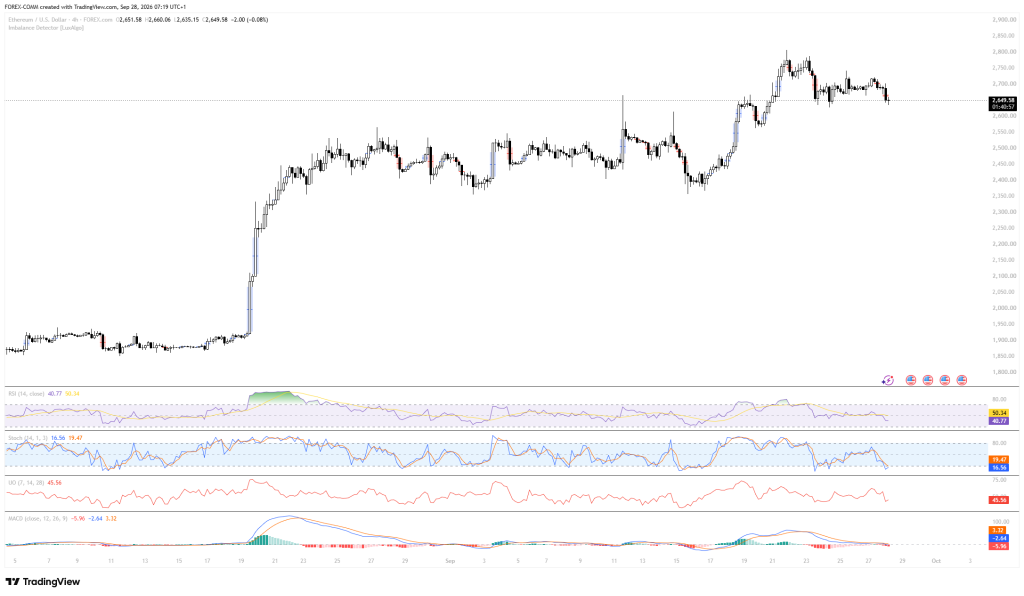
RSI at 41.76, STOCH at 21.45, and Ultimate Oscillator at 47.07 show weak-to-neutral momentum, ad MACD at -2.32 remains negative. The 2,600–2,620 area is the main support zone, with $2,700 and then $2,750 acting as resistance if buyers regain control.
| Indicator | Reading | Signal |
|---|---|---|
| RSI | 41.76 | Oversold |
| STOCH | 21.45 | Neutral/Bearish |
| Ultimate Oscillator | 47.07 | Neutral/Bearish |
| MACD | -2.32 | Bearish |
Key Factors Pushing the Ethereum Price Presently
U.S. spot Ethereum ETFs recorded about $689.9 million in net inflows during the week ending September 25, reversing the previous week’s roughly $140 million outflow. The flows lifted cumulative net inflows to about $13.94 billion, giving the Ethereum price a strong institutional demand source even as the wider market trades lower.
Macro pressure remains the main short-term obstacle, with the total crypto market cap down 1.05% and the 10-year Treasury yield moving above 5% as traders price in greater odds of another Fed hike. Bitcoin’s $51.32 million liquidation event also shows how leveraged positioning can spill across the market and add pressure to ETH, making the September 30 PCE inflation report an important catalyst.
Ethereum also has a longer-term development catalyst after Vitalik Buterin described Hegotá, planned for 2027, as the network’s last “normal” fork, with future development relying more heavily on cryptographic proofs and advanced infrastructure. Ethereum’s roadmap places Hegotá in Q2 2027, although the exact mainnet date remains unconfirmed.
Ethereum Price Prediction for Today
Bullish Prediction:
A break above $2,700 could push the Ethereum price toward $2,750.
Neutral Prediction:
The ETH price could trade between $2,600 and $2,700.
Bearish Prediction:
A break below $2,600 could expose the Ethereum price to $2,550.
Frequently Asked Questions
Subscribe to our YouTube channel for daily crypto updates, market insights, and expert analysis.