XRP price is trading around $1.42 today, but one longtime member of the XRP community is looking at a price target that would require an extraordinary rally.
Crypto analyst EGRAG CRYPTO has published a new long-term chart identifying $589 as a potential XRP price target. His projection is based on a diamond chart pattern, a broader ascending structure and a series of technical price levels.
The analyst is careful to distinguish the projection from a conventional forecast. He has not provided a deadline and explicitly states that April 2028, a date marked on his chart, is not a prediction that XRP will reach $589 by then.
Even with that distinction, the target deserves considerable scrutiny. A move from $1.42 to $589 would require XRP to increase more than 426-fold.
What you'll learn 👉
EGRAG CRYPTO Maps an Extraordinary Path to $589
In his latest post on X, EGRAG CRYPTO compares his analysis to a space mission. Rather than predicting when XRP will reach a particular price, he says he is identifying potential destinations based on its long-term chart.
His proposed targets are $5, $11.50, $25, $60, $135, $300 and ultimately $589.
The chart displays these levels within a broad ascending channel that extends from XRP’s early trading history into the coming years. Its upward-sloping boundaries form the foundation of the analyst’s long-term bullish interpretation.
EGRAG also points to a diamond pattern, which he believes could eventually produce a substantial upward move.
However, the chart does not show a confirmed breakout from that pattern. The analyst identifies three conditions that must be met first: XRP must hold its 77-period exponential moving average, reclaim its 33-period EMA and break above diamond-pattern resistance.
Until then, the $589 projection remains a hypothetical technical scenario.
XRP Price Chart: The Immediate Levels Matter More Than $589
EGRAG’s monthly chart shows XRP trading near $1.3807 after a substantial decline from its previous highs.
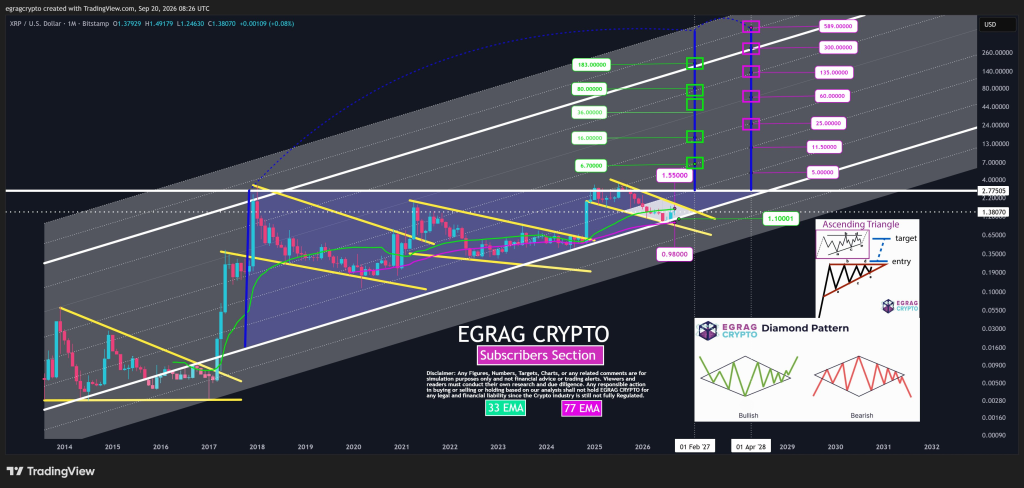
The price is approaching an important intersection of several technical features, including the rising support line of the broader ascending structure and the descending resistance line drawn across recent price action.
This creates a potential decision point, but the direction has not yet been confirmed.
The chart identifies approximately $1.10 as a lower support reference and $0.98 as another important level. Losing these areas would weaken the interpretation that XRP is building a foundation for another major advance.
On the upside, the analyst marks $1.55 as an immediate technical reference. A recovery above that level would improve the near-term structure, although XRP would still need to overcome the descending resistance line.
The horizontal level around $2.775 is another significant obstacle. It sits well above the current price and would need to be reclaimed before the much larger projections become relevant.
| XRP price level | Significance |
|---|---|
| $1.55 | Immediate upside reference on EGRAG’s chart |
| $2.775 | Major horizontal resistance |
| $5 | First of the analyst’s long-term targets |
| $11.50–$25 | Intermediate speculative targets |
| $60–$300 | Higher macro projections |
| $589 | Final hypothetical target |
| $1.10 | Important lower support reference |
| $0.98 | Deeper support; losing it would weaken the bullish structure |
One important detail is that the chart uses a logarithmic price scale. This makes percentage-based moves easier to compare across XRP’s history, but it can also make enormous absolute price increases appear visually less dramatic.
The diamond-pattern illustration also presents both bullish and bearish outcomes. The formation itself does not guarantee an upward breakout.
Read also: We Asked Claude AI If XRP Price Could Fall Below $1 Again in 2027
Is a $589 XRP Price Actually Realistic?
This is where the prediction becomes difficult to justify using conventional valuation measures.
At approximately $1.38, XRP would need to rise around 42,600% to reach $589.
The implied market capitalization is an even bigger consideration.
Using an illustrative circulating supply of 60 billion XRP, the valuation would look like this:
| XRP price | Implied market capitalization |
|---|---|
| $5 | $300 billion |
| $11.50 | $690 billion |
| $25 | $1.5 trillion |
| $60 | $3.6 trillion |
| $135 | $8.1 trillion |
| $300 | $18 trillion |
| $589 | $35.34 trillion |
These figures are illustrative calculations using a fixed supply assumption of 60 billion XRP, not a verified current circulating-supply figure or a forecast of future supply.
A valuation above $35 trillion would require an extraordinary expansion in XRP demand and its role within global financial markets.
That does not make the target mathematically impossible. However, a technical chart alone cannot establish the economic conditions needed to support such a valuation.
The projection would require far more than a successful breakout. It would depend on sustained demand, substantial capital inflows and a much larger role for XRP over an extended period.
Furthermore, Ripple’s business growth, stablecoin adoption or the expansion of tokenized assets would not automatically translate into equivalent demand for XRP.
There is also no demonstrated mechanism in the chart explaining why the final target should be precisely $589 rather than another price within the projected channel.
For more crypto news and price predictions, click here.
Subscribe to our YouTube channel for daily crypto updates, market insights, and expert analysis.