
Three prices could decide how today unfolds: $2,450 for Ethereum, $1.32 for XRP, and $11.10 for Chainlink. Each asset is close to a level that has separated a possible recovery from another move lower.
The charts offer different possibilities, but the next test of those levels matters more than any single indicator reading.
What you'll learn 👉
Ethereum Price Remains Inside Its Late August Range
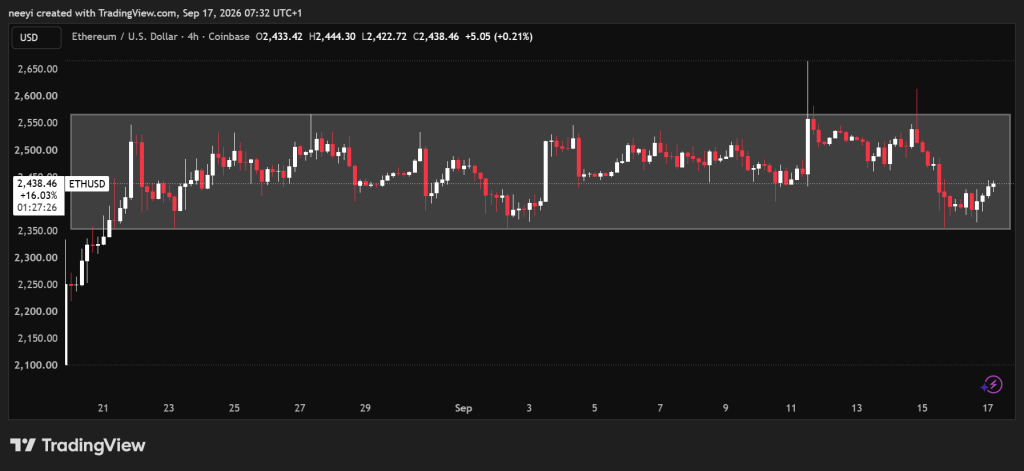
Ethereum price has moved between roughly $2,350 and $2,570 since the end of August. That range remains intact, so another day of consolidation is possible. The level near $2,450 divides the range into an upper and lower section and offers the first clue about where ETH could travel next.
A move above $2,450 could carry Ethereum price toward $2,550 in the coming sessions. If ETH cannot get past the middle of the range, a return toward $2,360 becomes possible. The lower boundary near $2,350 matters even more because a break beneath it could expose $2,270.
The indicator readings from Investing.com’s five-hour chart lean cautious. The RSI(14) stands at 46.587 and is neutral, which fits a market that has not settled on a direction. The Stochastic(9,6) reads 32.708 with a sell signal, so the short-term move still lacks strength. MACD(12,26) is at -22.18 and also gives a sell signal. Bull/Bear Power(13) reads -7.5101, another sell signal that points to weak buying pressure. Together, those readings make a clear move above $2,450 especially useful for judging whether the upper part of the range is within reach.
Ethereum’s moving averages tell a more mixed story. Both MA10 readings carry buy signals and lie near $2,420 to $2,431, which could help support a move within the range. Both MA50 readings carry sell signals near $2,468 to $2,481. Those levels could make an advance beyond $2,450 difficult. The MA200 readings remain on buy signals near $2,282 to $2,309, below the current consolidation.
| Moving Average | Simple Value | Simple Signal | Exponential Value | Exponential Signal |
|---|---|---|---|---|
| MA10 | $2,419.97 | Buy | $2,431.04 | Buy |
| MA50 | $2,480.56 | Sell | $2,467.89 | Sell |
| MA200 | $2,282.10 | Buy | $2,309.18 | Buy |
Ethereum Price Prediction for Today
- Bullish scenario: ETH moves above $2,450 and holds there. That would put $2,550 within reach, although the MA50 levels could slow the climb.
- Neutral scenario: Ethereum continues to trade inside the $2,350 to $2,570 range, with $2,450 dividing its daily moves.
- Bearish scenario: ETH falls toward $2,360 and then breaks below $2,350. That would open a possible path toward $2,270.
XRP Price Faces Another Test After Failing at $1.32
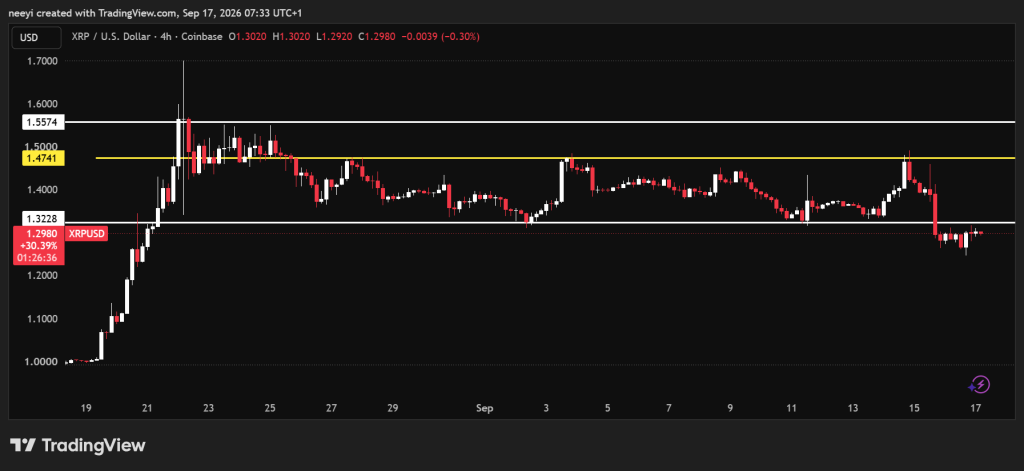
XRP price tested resistance near $1.32 yesterday but could not break above it. That failed attempt leaves the level as a hurdle today. Yesterday’s low near $1.24 is the next price to watch if XRP turns lower again. A break below that low could take the asset toward $1.20 before the day ends.
The recovery path begins with a move back above $1.32. That would return XRP price to its former consolidation area between $1.32 and $1.47. A break beyond $1.47 would offer a stronger bullish signal and could bring $1.55 into view today.
Investing.com’s five-hour indicators show why XRP needs to reclaim resistance before the recovery case becomes convincing. RSI(14) reads 43.546 with a sell signal, placing it below the neutral midpoint. The Stochastic(9,6) stands at 20.046 and also signals sell. MACD(12,26) is at -0.025 with a sell reading, and Bull/Bear Power(13) is at -0.0267 with the same signal. All 4 indicators currently favor caution as XRP tests its nearby levels.
The moving averages mostly support that reading. Both MA10 values sit close to $1.31 and carry sell signals, so XRP would need to regain that area on its way toward $1.32. Both MA50 values are higher, near $1.36 to $1.37, and also signal sell. The simple MA200 at $1.2710 carries a buy signal, but the exponential MA200 at $1.2990 carries a sell signal. That split makes the longer average readings less decisive than the nearby $1.32 resistance.
| Moving Average | Simple Value | Simple Signal | Exponential Value | Exponential Signal |
|---|---|---|---|---|
| MA10 | $1.3108 | Sell | $1.3111 | Sell |
| MA50 | $1.3696 | Sell | $1.3590 | Sell |
| MA200 | $1.2710 | Buy | $1.2990 | Sell |
XRP Price Prediction for Today
- Bullish scenario: XRP reclaims $1.32, moves through the former range, and breaks above $1.47. That could put $1.55 within reach.
- Neutral scenario: XRP returns above $1.32 but remains between that level and $1.47 for the rest of the day.
- Bearish scenario: Resistance at $1.32 holds, and XRP retests yesterday’s $1.24 low. A break below it could lead toward $1.20.
Read Also: Cardano’s ADA Price Could Be Days Away From a Big Pump!
Chainlink Price Tests $11.10 After Breaking Its Former Range
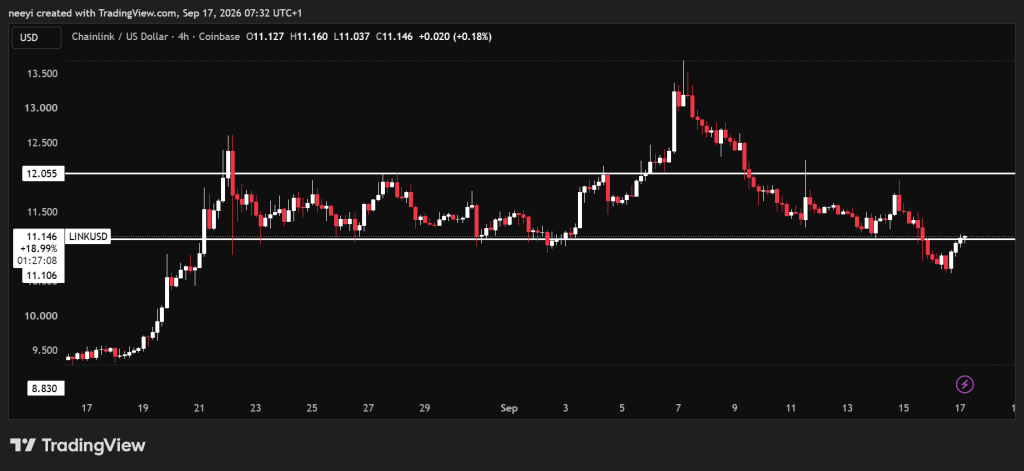
Chainlink price broke below its consolidation area 2 days ago and moved lower yesterday, reaching about $10.60. LINK is now testing the former boundary near $11.10. The outcome could determine whether yesterday’s low gets another visit or the price moves back into its previous range.
If $11.10 continues to act as resistance, Chainlink price could return to $10.60. A deeper decline could take LINK toward $9. If LINK breaks above $11.10 instead, $11.50 becomes the next level to watch. A move through $11.50 could extend toward $12 before the day ends.
The Investing.com five-hour indicators do not all point the same way. RSI(14) reads 45.829 and remains neutral. The Stochastic(9,6) stands at 32.581 with a sell signal, and MACD(12,26) reads -0.241 with another sell signal. Bull/Bear Power(13), however, is positive at 0.028 and carries a buy signal. That lone buy reading offers some support for the current test of $11.10, though LINK still needs to clear resistance to strengthen the recovery case.
Chainlink’s moving averages show a similar divide. Both MA10 readings, near $11.01 and $11.07, carry buy signals. They are close to the $11.10 test and could offer support if LINK holds above them. Both MA50 readings signal sell near $11.46 and $11.74, placing possible obstacles around and beyond $11.50. The MA200 readings near $10.73 and $10.81 remain on buy signals, close to yesterday’s $10.60 low.
| Moving Average | Simple Value | Simple Signal | Exponential Value | Exponential Signal |
|---|---|---|---|---|
| MA10 | $11.013 | Buy | $11.065 | Buy |
| MA50 | $11.736 | Sell | $11.457 | Sell |
| MA200 | $10.728 | Buy | $10.811 | Buy |
Chainlink Price Prediction for Today
- Bullish scenario: LINK breaks above $11.10 and then clears $11.50. That could allow Chainlink price to reach $12 before the day ends.
- Neutral scenario: LINK trades around $11.10 without a clear break, leaving the direction uncertain.
- Bearish scenario: $11.10 holds as resistance, and LINK returns to $10.60. A further break lower could put $9 in view.
FAQs
Subscribe to our YouTube channel for daily crypto updates, market insights, and expert analysis.