XRP price is being compressed between two major long-term moving averages, creating a technical setup that one analyst believes has historically ended badly for the cryptocurrency.
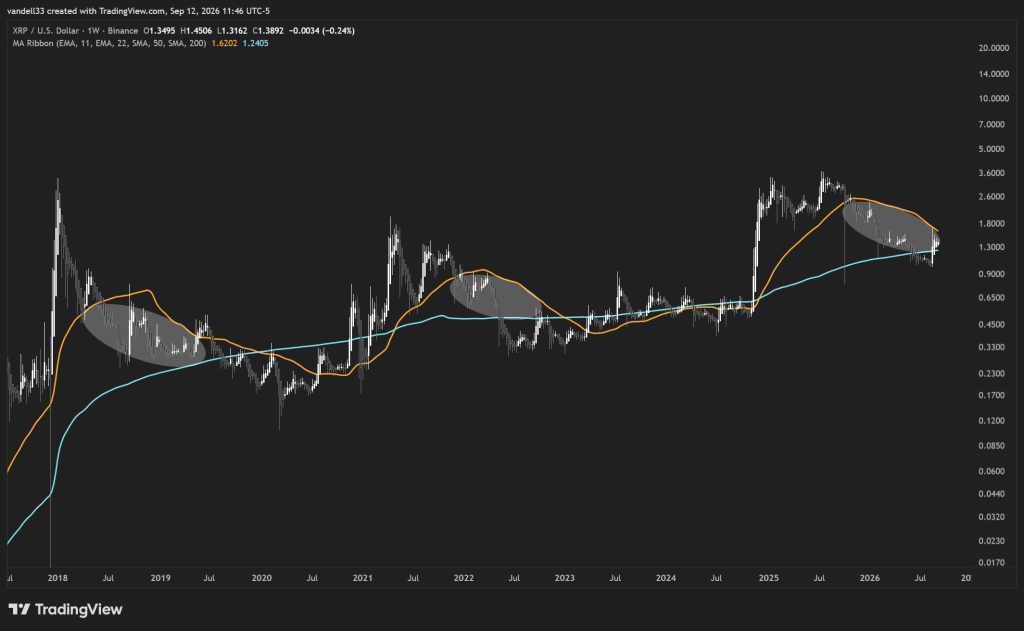
Analyst Vandell drew attention to XRP’s weekly chart, arguing that the token is between its 50-week and 200-week moving averages. His concern is not simply that XRP is consolidating, but that similar periods of compression in previous cycles eventually ended with the lower boundary giving way.
XRP is currently trading around $1.35, down about 5% over the past seven days. The XRP price has struggled to establish a clear direction after its August recovery, leaving the market increasingly compressed as the two long-term trend lines converge.
What you'll learn 👉
XRP Is Getting Squeezed Between Two Long-Term Levels
Vandell’s weekly Binance chart makes the compression easy to see.
The upper orange moving-average boundary is currently around $1.62 and continues to slope downward. Meanwhile, the lower cyan boundary has climbed to approximately $1.24.
XRP itself is around $1.35–$1.39 on the chart, placing the price much closer to the lower half of that narrowing range.
The analyst points to two previous examples.
Following XRP’s 2018 peak, the upper moving average descended while the longer-term average rose underneath the price. XRP became increasingly compressed between them before eventually losing the lower boundary and falling considerably further.
A similar structure appeared following the 2021 cycle. XRP again traded inside the narrowing space between the two averages before eventually breaking underneath the lower one during the 2022 bear market.
Vandell therefore sees the current formation as another potentially dangerous compression.
There is an important limitation, however. Two previous examples aren’t enough to establish that the same outcome must happen again. Moving averages are also lagging indicators, and the eventual direction will be determined by price rather than the compression itself.
So “historically always ends with the floor breaking” is better treated as Vandell’s interpretation of XRP’s previous cycles rather than a rule.
What Happens If XRP Loses the Floor?
The immediate price structure makes the next several weeks particularly interesting.
XRP has recently been trading around $1.33–$1.40, with approximately $1.30 emerging as an important short-term floor. The long-term moving-average support on Vandell’s chart sits lower, around $1.24.
That gives bulls two layers to defend.
If XRP loses $1.30, a move toward approximately $1.24–$1.25 becomes increasingly plausible. That would put the token directly against the rising long-term boundary Vandell is watching.
A weekly breakdown beneath that area would make his bearish historical comparison much more compelling. From there, the psychological $1 level could eventually become relevant again.
But the chart isn’t exclusively bearish.
The descending upper boundary is around $1.62. If XRP can instead recover through $1.40–$1.45, break $1.50 and eventually reclaim the $1.60–$1.62 region on the weekly timeframe, it would begin invalidating the idea that this compression must resolve downward.
That would represent a very different outcome from the historical examples Vandell identifies.
Read also: We Asked ChatGPT If XRP Can Reach $5 Before Bitcoin Reaches $150K
XRP Price Outlook
For now, the chart calls for caution rather than assuming another major XRP crash is inevitable.
In the short term, $1.30–$1.33 remains the key support zone. XRP needs to defend that region and recover above $1.40 before bulls can seriously challenge $1.45–$1.50 again. Recent daily momentum readings are also broadly neutral rather than showing a decisive trend.
The bigger battle is visible on Vandell’s weekly chart.
Approximately $1.24 represents the long-term floor, while the declining boundary around $1.62 represents the major ceiling. As those two lines continue moving closer together, XRP has progressively less room to remain trapped between them.
A break beneath $1.24 would give Vandell’s bearish thesis considerably more weight and could put $1 back into the conversation.
But a recovery through $1.50 followed by a weekly reclaim of roughly $1.60–$1.62 would turn the setup on its head and could create a much more constructive long-term picture.
For now, XRP hasn’t done either.
The squeeze is real. The claim that it must end with the floor breaking is not.
For more crypto news and price predictions, click here.
Subscribe to our YouTube channel for daily crypto updates, market insights, and expert analysis.