Silver price is nearing a technical area that has repeatedly stopped recovery attempts since January. DeepValue Signals believes the latest rebound has not confirmed a fresh upward move, and the wider chart presents an equally cautious picture. Several support levels could now determine whether silver steadies or enters another deeper correction.
The next reaction around $64.5 to $63 may provide the clearest clue. Silver could preserve its recovery structure above that area, though a confirmed breakdown would expose much lower levels.
What you'll learn 👉
DeepValue Signals Says Silver Has Not Confirmed a Strong Recovery
Crypto and commodities analyst DeepValue Signals recently examined silver after its price moved back toward $67. That level was positioned directly beneath a rising red trend structure visible on the analyst’s chart.
Silver needed to reclaim that structure to confirm that buyers had regained control. The required confirmation never appeared, which left the latest upward move looking more like a temporary recovery inside a correction.
A look at the chart shows silver struggling below the red resistance area. Price climbed from the lower region but failed to establish a convincing move above $67. That failure keeps several lower support levels relevant.
$SILVER
— DeepValue Signals (@DVSignals) September 8, 2026
So far, silver is not confirming the setup from this morning.
When I flagged ~$67, that level sat right underneath the rising red structure. As long as we remain below that area, the short-term action still feels corrective rather than impulsive to me…
I’d now want… https://t.co/F32TEe3sxl pic.twitter.com/8rlxuE9At0
DeepValue Signals identified these main areas:
- Silver must first defend the region between $65.5 and $64.5.
- Stronger structural support appears between $63 and $62.5.
- A clear loss of $62.5 could extend the current correction.
The distinction between corrective and impulsive price action matters here. An impulsive move normally breaks resistance decisively and continues higher. Corrective action often produces temporary rebounds that remain below an important technical barrier.
Silver currently appears closer to the second situation based on the analyst’s chart. Buyers still have time to change that picture, though they would need to recover $67 and remain above the rising red structure.
Silver Price Support Could Decide Whether the Decline Continues
Silver’s immediate direction depends heavily on how price behaves around the first support region. A recovery from $65.5 to $64.5 would show that buyers remain active below the recent rebound.
Stronger pressure could send silver toward the next structural area between $63 and $62.5. That zone carries more importance because it has helped preserve the broader setup.
| Silver Price Area | Technical Meaning | Possible Reaction |
|---|---|---|
| Above $67 | Buyers reclaim nearby resistance | Recovery could become more convincing |
| $65.5 to $64.5 | First short term support region | Buyers may attempt another rebound |
| $63 to $62.5 | Main structural support region | Holding could protect the broader setup |
| Below $62.5 | Structural support breaks cleanly | The correction could continue lower |
A brief move beneath support would not necessarily confirm the bearish case. Silver would need to remain below the zone and fail to recover it before the breakdown carried greater weight.
Silver Price Remains Trapped Inside a Descending Channel
A look at silver price also shows an interesting pattern. Silver has traded inside a descending channel since reaching its last all time high near $121 during January.
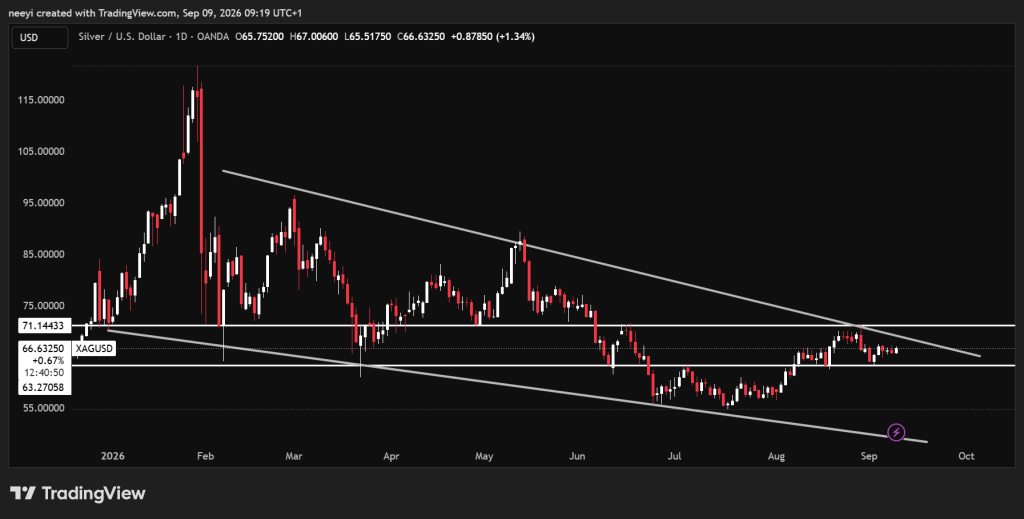
The price has continued to form lower highs and lower lows since that peak. The upper boundary of the channel acts as resistance, and the lower boundary provides support.
Previous encounters with the upper boundary have produced declines toward the channel’s base. That sequence has repeated several times, which makes the current position especially important.
Silver price is once again close to the upper section of the channel near $68 to $71. Another rejection from that region could return price toward $63, where the channel support and DeepValue Signals’ structural zone become relevant.
A breakdown beneath $63 would weaken the pattern further. Silver could then move below $54 during the coming days if sellers maintain control and price follows the existing channel toward its lower boundary.
Read Also: 3 Reasons Kaspa Is Back on Crypto Traders’ Radar
Silver Price Faces 2 Clear Scenarios From Here
The bullish scenario requires silver to defend $64.5 and recover above $67. A stronger confirmation would arrive if price breaks the descending channel resistance between $68 and $71. Such a move would challenge the sequence of lower highs that has controlled the chart since January.
The bearish scenario begins with another rejection near the channel’s upper boundary. Silver could then revisit $64.5 before testing the stronger support between $63 and $62.5. A clean breakdown there could open the path below $54.
Silver therefore remains caught between a nearby recovery opportunity and a broader bearish structure. The next test around $67 may reveal whether buyers can finally break the pattern or whether the correction still has another stage ahead.
FAQs
Subscribe to our YouTube channel for daily crypto updates, market insights, and expert analysis.