Silver price has spent the past few days relatively quiet around $66, consolidating after a much stronger August. XAG/USD is currently around $65.8–$66, with the metal struggling to establish a clear direction after briefly falling below $65 last week.
That lack of movement doesn’t necessarily mean nothing important is happening underneath the surface.
Analyst Karel Mercx has drawn attention to what he calls “one of the strongest silver signals,” pointing to an increasingly negative spread between silver swap rates and interest rates. Meanwhile, another analyst sees the recent return toward $65 as a healthy test following August’s rally, with $70 potentially coming back into play if that support continues to hold.
Together, the two analyses make $65 particularly important for the next silver price move.
What you'll learn 👉
Karel Mercx Points to an Unusual Silver Market Signal
Mercx’s argument concerns the cost of borrowing silver rather than the spot price itself.
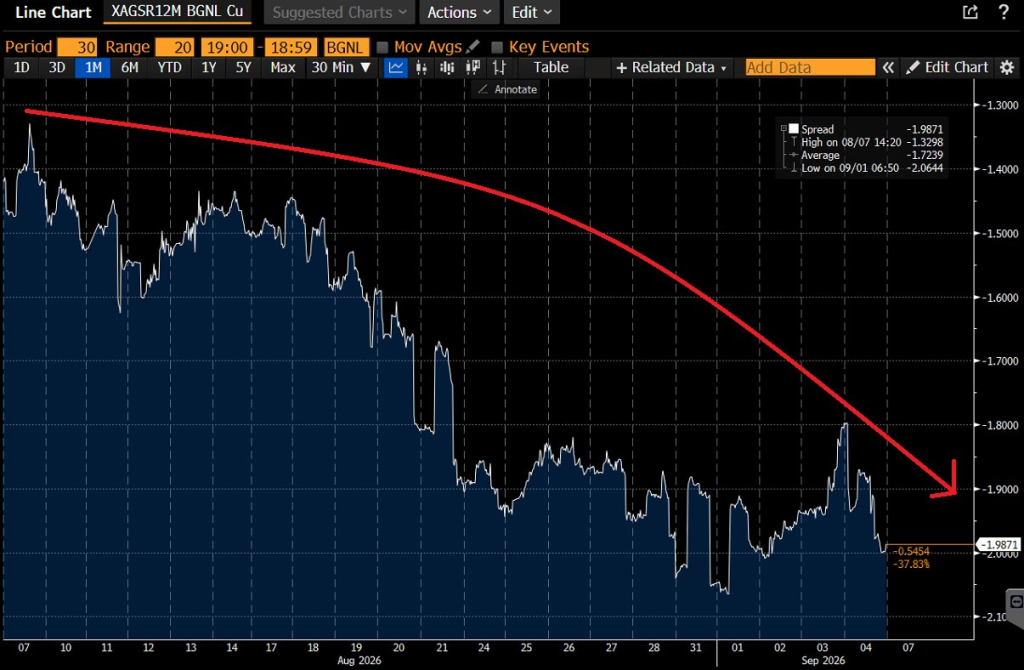
His chart tracks the spread between the 12-month silver swap rate and broader interest rates over the past month. That spread has become progressively more negative, falling from roughly -1.3 percentage points in early August toward approximately -2 percentage points in early September.
Mercx interprets that as evidence of unusually tight conditions in the silver lending market.
The basic idea is that physical silver has a lending value. When holders are reluctant to lend their metal, borrowers may need to pay more to obtain it. That higher implied borrowing cost can push the relevant silver rate farther below conventional interest rates.
The chart makes the development clear. The spread was around -1.3 in early August, averaged roughly -1.72 during the displayed period and briefly reached approximately -2.06 around September 1. It remains near -1.99 at the right side of the chart.
That’s a substantial change in only a month.
Mercx’s interpretation is that relatively few market participants are willing to lend silver for a year, while those willing to do so are demanding considerably more compensation.
If that reading is correct, the signal points to tightness in available lendable silver.
There is an important distinction, though. A deeply negative swap-rate spread isn’t proof that the entire physical silver market is about to run out of metal, nor does it guarantee an immediate price rally. Funding conditions, inventory location, hedging demand and stresses in particular parts of the bullion market can all affect these rates.
Still, persistent tightness becomes much more interesting when it appears alongside a silver market that has already faced structural supply constraints. The metal’s longer-term story continues to be supported by strong industrial consumption, particularly from electrification and related applications.
So while silver itself is barely moving around $66, Mercx believes something considerably more bullish may be developing beneath the surface.
Silver’s $65 Test Could Be More Important Than It Looks
The second silver chart gives us the technical side of the argument.
Fthegurus views the latest decline as a healthy pullback following silver’s strong August performance.
The exact monthly gain depends on the price series and cutoff used. Market data put August’s advance at roughly 15%–17%, with one cross-asset calculation showing about 15.6%.
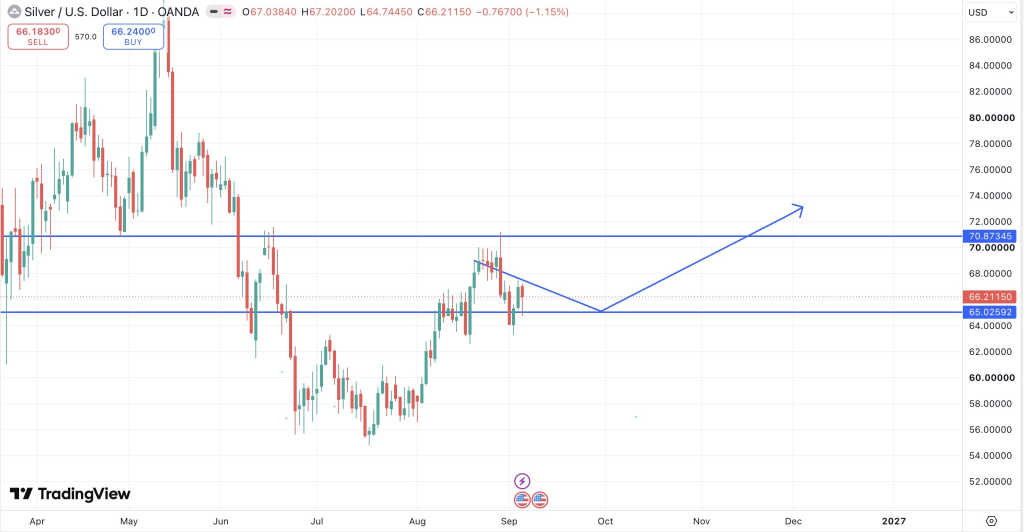
More importantly, silver climbed as high as approximately $71.19 on August 28 before reversing.
That brought price directly back toward the area marked on the chart at:
$65.03.
Silver briefly traded beneath $65 last week, reaching approximately $64.75, but buyers quickly pushed it back above $66.
That’s why the analyst calls it a “fake breakdown.”
Instead of accelerating lower once $65 failed intraday, silver recovered above the level. From a technical perspective, that makes the next test especially important.
The chart’s roadmap doesn’t anticipate an immediate vertical rally. It actually allows silver to spend much of September consolidating and potentially test $65 again before making another attempt higher.
That is an important part of the thesis.
Bulls don’t necessarily need $70 immediately. They first need to prove that the $65 region has turned into dependable support.
Read also: Silver Price Prediction: Bull Trap Could Send Prices Back to…
Why $70 Is the Next Major Silver Price Test
There is a clear range developing on the chart.
Silver has support around $65, while the next major resistance sits around $70.87.
Current market analysis similarly places silver inside a roughly $64–$68 short-term consolidation, with a move through $68 potentially reopening the recent $71 area.
The chart from Fthegurus projects a retest of $65 followed by a gradual recovery toward $70 and eventually above it.
That makes the roadmap fairly straightforward.
As long as silver continues defending approximately $65, the August recovery structure remains intact. Getting back above $68 would be the first encouraging development, while $70–$71 represents the much bigger hurdle.
Silver has already demonstrated why that region matters. Prices reached $71.19 in late August before sellers took control.
Breaking that area would therefore do more than simply put silver back at $70. It would take price above its latest major swing high and provide stronger evidence that the correction has ended.
Fthegurus doesn’t expect that to necessarily happen immediately. His thesis treats September as more of a consolidation month, with $70 potentially becoming an October objective.
Silver Price Prediction: What Happens After $65?
The combination of these two charts makes the current silver setup particularly interesting.
On the surface, very little is happening. Silver is around $66 and has spent several sessions moving back and forth around the same area.
Underneath that silver price action, however, Mercx sees unusually expensive silver borrowing conditions, while the technical chart shows buyers repeatedly appearing around $65.
Our base case would therefore remain constructive as long as $65 continues to hold on a closing basis.
A recovery through $67–$68 would put silver in position to challenge $70–$71 again. A convincing breakout above approximately $71 would then open the door toward the mid-$70s.
The downside scenario shouldn’t be ignored.
If silver decisively loses $65 rather than briefly trading underneath it and recovering, the bullish interpretation becomes weaker. The next downside areas would be around $63 and $61, which also line up with levels being watched by other technical analysts.
For now, however, there is little reason to demand an immediate pump.
Subscribe to our YouTube channel for daily crypto updates, market insights, and expert analysis.