
The gold price is trading around $4,430 after another volatile week, but the longer-term fundamental picture continues to receive support from one of the precious metal’s most important sources of demand: central banks.
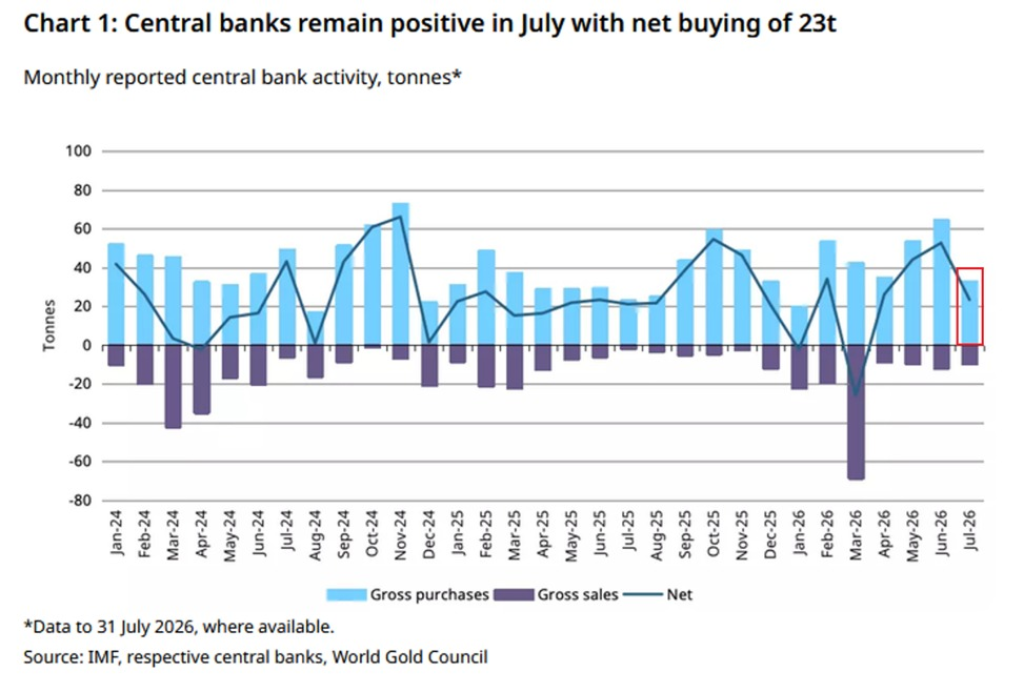
Global central banks were net buyers of 23 tonnes of gold in July, according to World Gold Council data shared by The Kobeissi Letter. That made July the fourth consecutive month of net buying, following a considerably larger 51-tonne increase in June.
The buying comes as gold attempts to stabilize following its correction from the record highs reached earlier this year. The TradingView chart provided for this analysis places gold near $4,430, almost directly around its rising 200-day moving average.
That creates an interesting setup. Central banks continue accumulating the metal, while the gold price is testing a technical area that could determine whether the longer-term uptrend resumes or another correction comes first.
What you'll learn 👉
Central Banks Bought Another 23 Tonnes of Gold
The World Gold Council chart provides a useful look at the persistence of official-sector demand.
July’s 23 tonnes of net purchases came from gross buying of roughly 40 tonnes, partially offset by sales. More importantly, July extended the current run of positive net demand to four consecutive months.
The Kobeissi Letter noted that June’s 51 tonnes represented the second-largest monthly purchase since November 2024.
China was reportedly the largest buyer in July, adding 20 tonnes and taking its purchases for 2026 to approximately 60 tonnes. Poland followed with another 8 tonnes, bringing its year-to-date total to around 90 tonnes.
Across central banks collectively, net purchases have reached approximately 130 tonnes in 2026, compared with roughly 160 tonnes over the equivalent period last year.
So official demand remains substantial, although the year-to-date figure is actually running somewhat behind 2025.
That’s an important distinction: central banks haven’t accelerated their aggregate purchases versus last year, but they have continued buying despite gold trading at historically elevated prices.
Why Continued Central Bank Buying Matters for Gold Price
Central banks aren’t typically trying to time short-term moves in gold.
Reserve managers can buy gold for diversification, geopolitical risk management, reduced dependence on foreign currencies and long-term reserve stability. That makes their behavior fundamentally different from traders reacting to a daily inflation report or interest-rate expectation.
The persistence of purchases therefore matters more than any individual month.
The chart shows positive net central-bank demand in April, May, June and July. Even after gold’s enormous multiyear appreciation, official institutions remain net buyers.
This doesn’t mean central-bank demand alone can keep the gold price rising. Interest rates, Treasury yields, the U.S. dollar, investor flows and geopolitical conditions can overpower physical and official-sector demand over shorter periods.
But persistent central-bank accumulation provides an underlying source of demand that could become particularly important during price corrections.
Bank of Korea Returns to Gold Exposure After 13 Years
Another notable development comes from South Korea.
According to The Kobeissi Letter, the Bank of Korea disclosed in August that it held approximately $250 million of SPDR Gold Shares (GLD) as of the second quarter of 2026.
The position is particularly interesting because it represents the central bank’s first reported gold investment in roughly 13 years.
There is an important distinction here, however.
Buying shares of a gold-backed ETF isn’t the same thing as a central bank adding physical bullion directly to its official gold reserves. The development still represents exposure to gold, but it shouldn’t be combined mechanically with physical central-bank purchases.
Taken together, however, the developments reinforce a broader point: institutional demand for gold hasn’t disappeared simply because prices are historically high.
Gold Price Analysis: 200-Day Moving Average Becomes Critical
The daily TradingView chart provides a more complicated short-term picture.
Gold is trading around $4,430, while the 200-day moving average sits at approximately $4,537.
That means the gold price is currently slightly below this major long-term trend indicator.
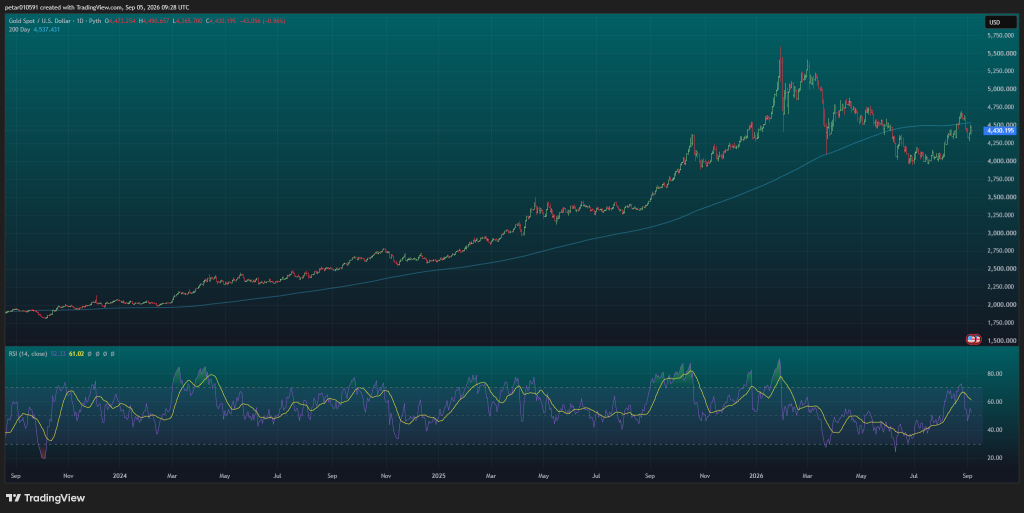
The 200-day moving average has played an increasingly important role during the 2026 correction. Gold spent much of 2024 and 2025 comfortably above it as the larger bull market accelerated. The relationship became far less stable following the explosive run above $5,000 earlier this year.
Gold subsequently fell toward approximately $4,000 before recovering strongly during August.
That rebound carried the price back above $4,500 and briefly toward the $4,650–$4,700 region. But buyers couldn’t maintain the move, and gold has now returned toward $4,430.
This puts the market back at an important decision point.
$4,500–$4,540 Is the First Level Bulls Need to Reclaim
The immediate obstacle is visible directly on the chart.
Gold needs to recover the $4,500–$4,540 region, with the 200-day moving average sitting near the upper end of that range.
A sustained recovery above the 200-day average would improve the technical picture considerably.
After that, the recent local high around $4,650–$4,700 becomes the next obvious obstacle.
Breaking that region would give bulls a stronger argument that the summer bottom around $4,000 marked the end of the larger correction.
From there, the chart opens toward roughly $4,800–$5,000, an area that previously produced considerable price activity.
The psychological $5,000 level would be especially important. Recovering it would put gold back within striking distance of the major 2026 highs.
Read also: Gold Price Prediction: Two Big Trends Are Pointing Toward $5,000
RSI Shows Gold Is Neither Overbought Nor Oversold
Momentum provides another reason not to expect an immediate straight-line move.
The daily RSI is around 52, placing it close to neutral territory.
That’s very different from the extreme readings recorded during some of gold’s previous rallies.
The indicator surged above 80 during several powerful advances, including around the beginning of 2026. Those conditions eventually preceded considerable volatility.
The current reading tells a different story.
Gold isn’t technically overbought, but it isn’t deeply oversold either. In other words, RSI isn’t forcing the market toward an immediate reversal in either direction.
The price itself—and particularly the battle around the 200-day moving average—should therefore carry more weight.
Gold Price Prediction: What Comes Next?
The central-bank data strengthens the longer-term bullish argument for gold, but the daily chart argues for more patience.
Our base case is that the $4,500–$4,540 region will determine the next meaningful move.
If gold reclaims its 200-day moving average and then breaks through approximately $4,650–$4,700, the recovery could extend toward $4,800 and eventually $5,000.
A clean move above $5,000 would substantially improve the case for another attempt at the 2026 highs around $5,400–$5,500.
The downside scenario begins if gold continues getting rejected around the 200-day average. In that case, another test of $4,300 is plausible, with $4,000–$4,100 becoming the critical support zone if selling intensifies.
Fundamentally, however, there is a notable difference between today’s setup and one in which official-sector demand is disappearing.
Central banks remain buyers.
Subscribe to our YouTube channel for daily crypto updates, market insights, and expert analysis.