The Kaspa price is back above $0.03 after gaining roughly 2.5% today, bringing KAS within striking distance of an important resistance area. The recovery follows several attempts by buyers to defend the $0.025 region, and one analyst believes the resulting structure could be preparing KAS for a much larger move.
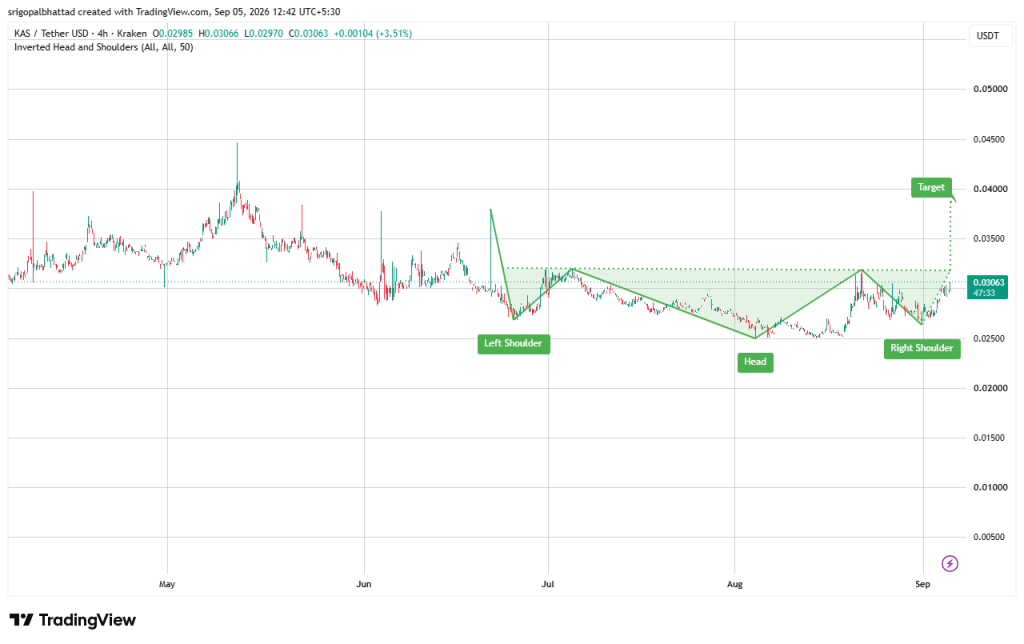
Crypto analyst Gopal drew attention to an inverse head-and-shoulders formation developing on Kaspa’s four-hour chart. According to his analysis, the right shoulder is now advancing toward a neckline around $0.032. If buyers can push through that barrier, his chart maps a potential move toward $0.040.
Recent trading data also shows that interest in Kaspa has picked up. CoinGecko recorded more than $13 million in KAS volume on September 4, compared with roughly $6.3 million the previous day, although volume figures vary between exchanges and data providers.
What you'll learn 👉
Kaspa Price Approaches $0.032
Gopal’s chart presents a fairly clean inverse head-and-shoulders structure.
The left shoulder formed around late June as KAS fell toward approximately $0.026 before recovering to the $0.032 area. Price subsequently rolled over again, producing a deeper low around $0.024–$0.025 in August. The analyst identifies this second low as the head of the formation.
The latest recovery followed another defense of approximately $0.025, creating what Gopal identifies as the right shoulder.
That leaves $0.032 as the crucial neckline.
This is important because an inverse head-and-shoulders isn’t fully confirmed simply because the three lows appear on a chart. Bulls still need to overcome the neckline.
KAS trading above $0.03 means that test could be approaching.
What Happens if KAS Breaks $0.032?
The analyst’s chart maps a move toward approximately $0.040 if KAS clears the neckline.
From $0.0306, reaching $0.04 would represent upside of roughly 31%.
There is some logic behind that target from a technical perspective. The distance between the head near $0.025 and neckline near $0.032 is approximately $0.007. Projecting a similar move above the neckline produces an objective close to $0.039–$0.040.
However, the important word is if.
KAS hasn’t decisively cleared $0.032 on the chart provided. In fact, this region has already rejected price multiple times, making it an obvious area where sellers could return.
A move above $0.032 followed by the level holding as support would make the analyst’s bullish scenario considerably stronger. A rejection would leave Kaspa inside the broader range.
The lower boundary is equally important. Another loss of $0.025 would damage the proposed inverse head-and-shoulders structure and weaken the case for $0.04.
Read also: Is Kaspa Price Finally Making a Comeback? Analyst Maps the Next KAS Targets
Kaspa Trading Activity Is Picking Up
The technical setup is appearing alongside increased activity around KAS.
A report published September 4 noted that Kaspa’s 24-hour trading volume had climbed nearly 30% while its price was up roughly 4%. The exact percentage depends on the data provider and measurement window; CoinGecko, for example, recorded approximately $13.17 million of volume for September 4, more than double its September 3 figure of about $6.31 million.
The broader crypto market also contributed to the move. CoinMarketCap’s market analysis found that Kaspa’s recent advance closely tracked a roughly 3.7% rise in the overall crypto market, meaning the move wasn’t necessarily driven entirely by Kaspa-specific developments.
Still, stronger volume matters around a level such as $0.032. If KAS attacks the neckline with sustained trading activity, the move would carry more weight than a brief low-volume push above resistance.
KASPY Rally Adds to Kaspa Community Activity
There has also been more activity elsewhere in the Kaspa ecosystem.
KASPY, a community-driven memecoin built on Kaspa, pumped approximately 55% over the past 30 days and 18% over seven days, according to a September 4 report. That considerably outpaced KAS over the same period.
The KASPY rally doesn’t directly create demand for KAS in a way that guarantees a higher Kaspa price. Memecoin performance can also reverse quickly.
What it does provide is another indication of increased retail attention around the Kaspa ecosystem. Combined with higher KAS trading activity and the recent price recovery, there appears to be more speculative interest around Kaspa than there was several weeks ago.
Is Kaspa Price Ready for the Bigger Move?
For now, $0.032 is the level that matters most.
Gopal’s inverse head-and-shoulders setup gives Kaspa a potential path toward $0.04, but the pattern still needs confirmation. KAS trading above $0.03 puts bulls close to the neckline without actually completing the technical setup.
A convincing move through $0.032 would make $0.035 a reasonable intermediate area to watch before the analyst’s larger $0.040 objective comes into focus.
On the other hand, repeated rejection around $0.032 could send KAS back toward $0.028 and eventually the $0.025 support area. Losing $0.025 would undermine the bullish structure that currently makes the chart interesting.
The combination of rising trading activity, renewed attention around the Kaspa ecosystem and an improving four-hour structure gives bulls something they haven’t had for much of the recent decline: a clearly defined route higher.
But the move they’ve been waiting for isn’t confirmed yet.
Subscribe to our YouTube channel for daily crypto updates, market insights, and expert analysis.