
Popular crypto analyst Cryptollica just made a massive Ethereum price prediction that caught my attention since I haven’t see this kind of bullish ETH forecast for a pretty long time.
In a blunt post on social media, Cryptollica laid out a fractal comparison between Ethereum’s current market structure and the 2018–2020 cycle that preceded a historic rally. The analyst’s message: history is repeating, and the next move could be far larger than most expect.
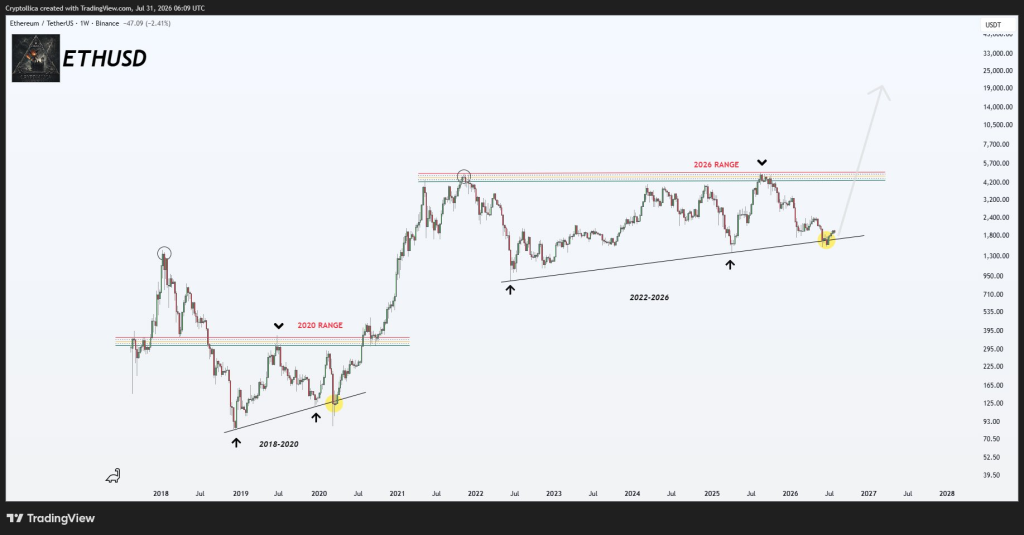
“ETHEREUM TO $20,000 IS EASIER THAN MOST THINK ⚠️,” Cryptollica wrote. The analyst broke it down in four short lines: “2018 to 2020 base ended with a final test of rising support beneath the old cycle range. 2022 to 2026 structure is now at the similar point. Similar compression. Same hated retest. Same disbelief.”
What you'll learn 👉
Breaking Down the Ethereum Chart
The weekly ETHUSD chart presents a fractal comparison between two distinct market cycles. The first period, spanning 2018 to 2020, shows Ethereum grinding through a prolonged base after the 2018 top. Price action eventually compressed into a rising wedge of higher lows beneath the horizontal resistance zone from that cycle’s range.
That structure resolved with a breakout that carried ETH from roughly $130 all the way to its 2021–2022 cycle top near $4,800; a move of well over 30x from the final retest point.
The second structure, covering 2022 to 2026, mirrors this setup almost exactly. After topping out in the $4,800 zone in late 2021 and early 2022, Ethereum spent nearly four years chopping sideways in a wide range, repeatedly testing and holding an ascending trendline of higher lows.
As of the chart dated July 31, 2026, the Ethereum price is right at that rising support line, currently trading around $1,780; the same kind of “final test” position the 2018–2020 structure showed just before its breakout.
The core argument here rests on structural symmetry rather than price levels. Both cycles show a multi-year basing period, a well-defined horizontal resistance zone from the prior cycle’s range, and a rising trendline that gets tested repeatedly before the eventual breakout. The chart’s projected arrow toward $20,000+ implies a continuation of the same percentage magnitude the 2018–2020 base produced, extrapolated onto the current setup.
A few caveats come with this kind of fractal analysis. Pattern similarity between two cycles does not guarantee identical outcomes, and macro conditions differ significantly between 2020 (a low-rate, pre-halving liquidity environment) and 2026, a market shaped by ETF flows, a new Federal Reserve regime, and different institutional dynamics.
Still, the compression pattern itself (long sideways range, repeated rising-support retests, shrinking volatility) is a legitimate and recognizable technical setup. The current position on the chart, right at the trendline and at a multi-year low relative to the range, is exactly where a decisive move would be expected to originate, in either direction.
If support fails to hold here, the bearish counterpart to this thesis would point toward a much deeper retest of the 2022–2026 range lows or even the top of the old 2020 range. This makes the chart a true “line in the sand” scenario, where the trendline holding or breaking matters more than the specific $20,000 target itself.
Read also: Ethereum Price Rally: 5 Reasons ETH Could Leave Bitcoin Behind
Ethereum Price Today
Ethereum dipped around 1.5% today and is now back below the $1,900 level. The cryptocurrency traded near $1,886 as of Friday morning, slipping from the previous day’s close around $1,918. Earlier in the session, ETH had been hovering between $1,907 and $1,918 before selling pressure pushed it lower.
On July 31, a monthly expiry of 435,000 Ether options with a notional value of $830 million settled. The put-call ratio came in at 0.63, meaning traders had bought more downside protection than upside calls. The settlement occurred with Ether trading near $1,891, above the $1,850 “max pain” level; the Ethereum price at which the largest number of options contracts would expire worthless. This expiry did not trigger a breakout from Ethereum’s recent trading range.
On the ETF front, U.S. spot Ethereum ETFs recorded $13.29 million in net inflows on July 30. BlackRock’s iShares Ethereum Trust (ETHA) led with $16.24 million in daily inflows, partially offset by outflows from Fidelity’s and Grayscale’s products. This follows a strong $233.1 million inflow day for Bitcoin spot ETFs on the same date.
Short-Term Outlook
Several analysts see Ethereum pushing toward the $2,000 level in the near term. One forecast projects ETH trading around $2,000 by early August, supported by improving ETF inflows and positive market sentiment following a tough second quarter. The projected trading range sits between $1,950 and $2,050, with potential upside to $2,200–$2,400 if ETF inflows and broader crypto momentum continue. On the downside, prices could fall back to $1,700–$1,850 if macroeconomic conditions worsen or institutional demand weakens.
Technical analysis on weekly timeframes suggests Ethereum recently broke above its $1,842–$1,868 resistance line, flipping that zone into new support. This opens a path toward $2,000 and the 200-day exponential moving average near $2,200. However, the long-term trend remains bearish until Ethereum surpasses its 200-day moving average. For now, all eyes remain on that rising support trendline; the same one Cryptollica believes could serve as the launchpad for Ethereum’s next major move.
Subscribe to our YouTube channel for daily crypto updates, market insights, and expert analysis.