Kaspa (KAS) has traded sideways for weeks. Social media chatter focuses on protocol upgrades, whale activity, and long-term potential.
The charts show something different. Momentum has cooled. Volatility has contracted. Price is approaching an area where a directional move is becoming increasingly likely.
Traders who ignore the chart and chase headlines risk getting caught on the wrong side of the next breakout. The technical picture does not scream bullish or bearish.
Here is what the chart actually shows and what it means for Kaspa price in the coming weeks.
What you'll learn 👉
Kaspa (KAS) Current Price Action
Kaspa (KAS) trades around the $0.028 level at the time of writing. The 24-hour range sits between $0.02798 and $0.02848, while the 7-day range extends from $0.02733 to $0.02874.
After failing to sustain rallies above $0.031-$0.032 earlier this month, sellers pushed price back toward support. Bears have tested the $0.0275-$0.0280 zone multiple times but have not produced a decisive breakdown. Buyers remain active at these levels, though they have shown little appetite to push price higher.
Key support levels to watch
- $0.0275-$0.0280: Immediate support and lower boundary of recent consolidation
- $0.0260-$0.0265: Stronger daily support from previous swing lows
- $0.0250: Major structural support if selling accelerates
Key resistance levels to watch
- $0.0295-$0.0300: First resistance bulls must reclaim
- $0.0315-$0.0320: Recent rejection zone
- $0.035-$0.036: Major resistance from June
Short-term traders should treat this as a range-bound market until price breaks one of these levels with conviction.
What the Chart Actually Shows
The technical analysis is more balanced than recent sentiment suggests. The daily chart shows Kaspa (KAS) printing lower highs following the May rally. Every recovery attempt has stalled beneath previous swing highs and shows that the sellers still control the broader trend.
The 4-hour chart strengthens this view. Since early July, price moved inside a shallow descending structure before flattening into horizontal consolidation. The market is digesting previous losses rather than trending.
Momentum indicators offer mixed signals. The daily Ultimate Oscillator has recovered toward 55, moving back above its midline after spending much of July below 50.
Bearish momentum has weakened, but this does not confirm a new bullish trend. Historically, Kaspa (KAS) has needed oscillator readings above 60 alongside strong price expansion before sustainable rallies developed.
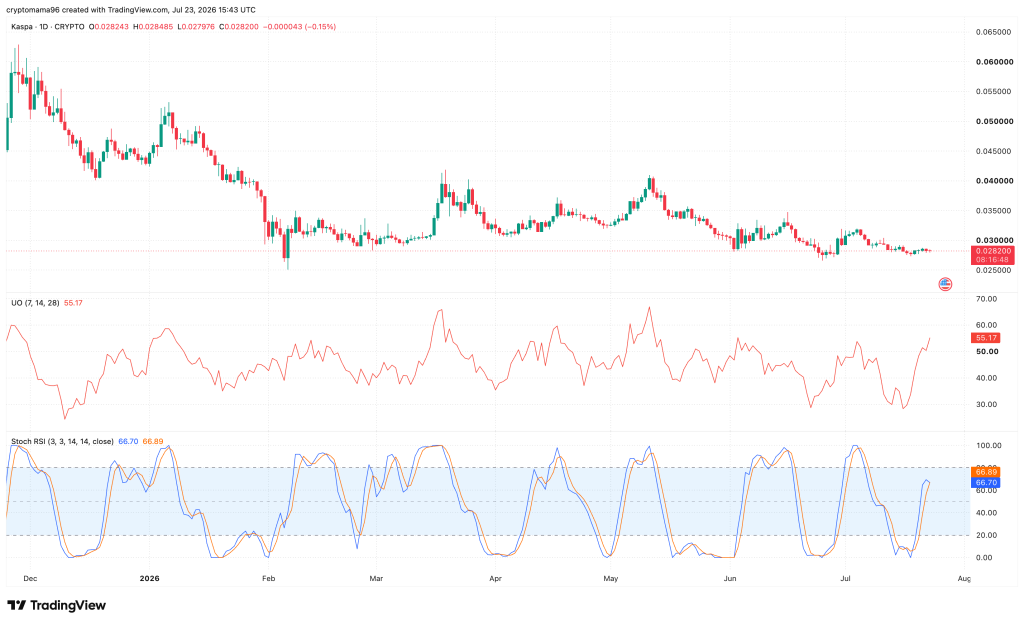
The daily Stochastic RSI has turned sharply higher after recovering from oversold territory. Both lines are climbing toward the upper half of the indicator. This usually shows improving short-term momentum rather than a confirmed breakout.
The 4-hour Stochastic RSI has also crossed upward from oversold conditions and favors another attempt toward resistance. These signals frequently fail when price remains trapped inside consolidation.
Perhaps the most important observation is what price is not doing. Recent candles have become progressively smaller. Volatility has contracted noticeably compared to earlier months. This compression often precedes a stronger directional move.
Compression itself is neutral. The breakout direction will decide whether Kaspa (KAS) resumes a recovery or extends its broader downtrend.
For confirmation, traders should watch for a daily close above $0.0300-$0.0310 to favor bullish continuation or a daily close below $0.0275 to increase downside risk.
Kaspa News
The Kaspa ecosystem continues to improve even though price has yet to fully affect those developments.
The biggest catalyst remains the successful Toccata mainnet upgrade at the end of June. This introduced covenant-based programmability, native token functionality, and zero-knowledge proof capabilities, expanding Kaspa beyond its original payments-focused design. The market is watching whether developers build meaningful applications on these new capabilities.
Investor sentiment received a boost after reports of a major whale accumulating approximately $42.9 million worth of KAS. An unidentified entity increased its holdings to 1.47 billion KAS, becoming the network’s largest non-exchange holder.
While whale accumulation does not guarantee higher Kaspa prices, it generally shows long-term conviction and reduces circulating exchange supply.
Looking ahead, attention is changing toward Kaspa’s planned DAGKnight consensus upgrade. This aims to improve confirmation responsiveness and network efficiency.
Not all news is positive. A recent security incident involving a reported loss of nearly 400,000 KAS from a hardware wallet shows the risks of self-custody.
Prominent on-chain investigator ZachXBT declined to take the case and cited a minimum threshold of $250,000 and overwhelming demand.
Read also: XRP Holders: The Clarity Act Is More Important Than the SEC Ruling – Here’s Why
What This Means for KAS Price Going Forward
Kaspa (KAS) is approaching an inflection point. The daily trend has stabilized after months of weakness. Short-term momentum is improving. Volatility has compressed enough that a larger move appears increasingly likely.
The bullish scenario requires a break above $0.0300-$0.0310, follow-through toward $0.032-$0.035, and higher highs forming on both the daily and 4-hour charts.
The bearish scenario begins if $0.0275** support fails on a daily closing basis, price moves below **$0.0260, and momentum indicators roll back into oversold territory without producing a higher low.
For now, the evidence favors patience over prediction. Improving oscillators suggest selling pressure is fading, but the overall trend has not yet reversed.
Frequently Asked Questions
Subscribe to our YouTube channel for daily crypto updates, market insights, and expert analysis.