
Bitcoin and Solana have both recovered from their June lows, but neither asset has convinced every market analyst that the worst is over. Recent price gains have improved sentiment, although one technical analyst believes the latest rallies still resemble temporary rebounds instead of the beginning of a fresh bull market.
That comparison becomes even more interesting when Bitcoin and Solana are placed side by side. A recent analysis from the More Crypto Online YouTube channel argues that one of the two assets still appears weaker. The analyst also outlined several price levels that could determine whether the current recovery continues or fades.
What you'll learn 👉
Bitcoin Price Continues to Recover but Major Resistance Still Remains
Bitcoin is trading at $65,711, which leaves the BTC price about 47.88% below its all time high of $126,080, reached on October 6, 2025.
The months after that record high brought several sharp moves across the market. Bitcoin dropped to $84,648 in November before ending 2025 close to $92,119. Early 2026 delivered another rally that carried BTC price to $97,963 during January before heavy selling pushed it down to $60,001 in February.
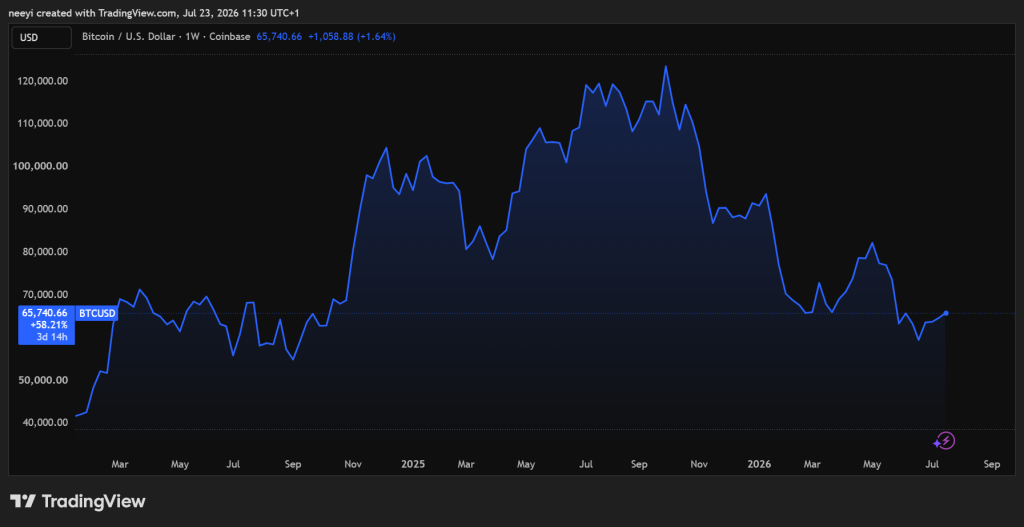
March brought a lengthy consolidation period between roughly $67,000 and $75,000. Buyers repeatedly defended the $62,000 to $65,000 region. April and May produced another recovery above $80,000, although that strength faded after macroeconomic pressure and large spot Bitcoin ETF outflows returned during June.
Recent trading has looked more stable. Six straight days of spot ETF inflows helped Bitcoin climb above $66,000 before the market settled back into a consolidation range between roughly $62,500 and $65,500.
Solana Price Has Recovered Strongly but Still Trails Its Previous High
The current SOL price stands near $77.99, leaving Solana about 73.41% below its all time high of $293.31, recorded on January 19, 2025.
The road back has been difficult. Solana lost substantial value after its January 2025 peak. Profit taking, network security concerns, and broader crypto market weakness eventually drove the token to a major low before the ecosystem began to stabilize.
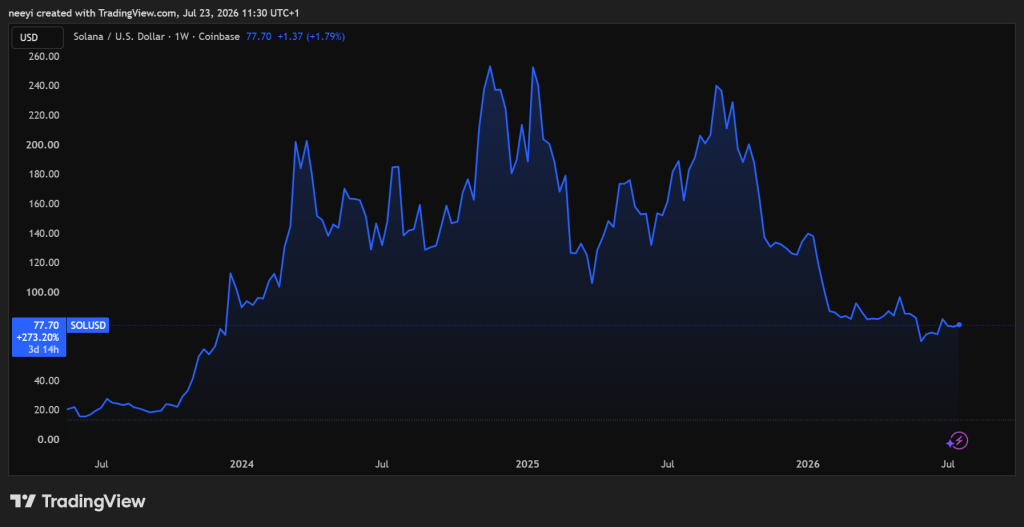
Early 2026 brought another series of swings. January delivered a brief recovery before macro uncertainty weighed on the market during February. March and April produced steadier trading as blockchain activity improved through meme coin activity and tokenized stock projects.
June marked another weak period for SOL price after bearish market conditions pushed the asset to its lowest level of the year. July has looked much stronger. Higher decentralized exchange volumes and the Pump.fun automated supply burn buyback program helped Solana rebound into the $74 to $83 region, where it currently continues to trade.
More Crypto Online Says Solana and Bitcoin Still Share the Same Bearish Structure
The analyst from More Crypto Online believes Bitcoin and Solana remain trapped inside broader downtrends despite the recent recovery.
The analysis argues that the rally from June resembles a classic three wave corrective move instead of a powerful impulse that normally marks the beginning of a new bull trend. Because of that structure, the analyst does not believe there is enough evidence to confirm that either Bitcoin or Solana has established a major market bottom.
Another point raised during the analysis concerns resistance. Solana has not broken above the first important resistance zone near $98.50. Until that happens, the analyst believes buyers have not taken clear control of the market.
The analyst also noted that Bitcoin appears to be forming a similar corrective structure. Since both assets remain highly correlated, another rejection for BTC price could easily pull SOL price lower as well.
Solana Could Face Deeper Losses if Key Support Breaks
The More Crypto Online analyst outlined several levels that deserve close attention over the coming days.
Key levels include:
- Resistance remains near $89.27, $94, and $98.50.
- Primary support sits around $74.
- A break below $64.30 could confirm another bearish wave.
- Additional downside targets stand near $48.80 and $43.22.
The analyst stressed that the current bounce still looks corrective. That means Solana could still climb toward resistance before another decline begins.
A stronger bullish case would require something different. The analyst explained that a clear five wave advance would provide much stronger evidence that a lasting bottom has formed.
Read Also: Claude AI Predicts Bitcoin Price if the CLARITY Act Is Delayed Until 2027
Solana Still Looks Weaker Than Bitcoin on the SOL BTC Chart
The comparison between Solana and Bitcoin formed one of the main conclusions from the analysis.
A look at the SOL BTC chart led the analyst to conclude that Solana continues to underperform Bitcoin on the larger trend. Recent gains have improved short term performance, although the broader structure still points lower.
The analyst explained that Solana briefly outperformed Bitcoin after the June lows. That move still unfolded as another three wave advance. Because of that, the chart does not confirm that Solana has started a sustained period of outperformance against Bitcoin.
The analysis argues that a genuine trend reversal would require a clean five-wave advance from the June low. Until that appears, the analyst expects Solana to remain more vulnerable than Bitcoin if another market decline develops.
FAQs
Subscribe to our YouTube channel for daily crypto updates, market insights, and expert analysis.