
The past few months have not been good for Ethereum as its price fell to as low as $1,652, having declined over 30% from levels above $2,350-$2,400. It appears that although the chart is still bearish, there is an emerging narrative that may keep Ethereum on their radar.
Crypto analyst Lucky pointed out that Ethereum now accounts for 47.1% of all tokenized stock issuance. That means nearly half of the equities moving onto blockchain networks are being built on Ethereum, reinforcing its position as the leading infrastructure for real-world assets.
The trend is worth watching because every tokenized stock brings more activity to the network, more institutional participation, and another reason for developers and financial firms to keep choosing Ethereum.
Ethereum is quietly becoming the backbone of tokenized stocks. Ethereum now accounts for 47.1% of all tokenized stock issuance.
— Lucky (@LLuciano_BTC) June 10, 2026
That’s not just a market share number. It’s a signal that when institutions bring real-world assets on-chain, they continue to trust Ethereum more… pic.twitter.com/ACKaaYFmjO
What you'll learn 👉
The ETH Price Is Defending An Important Support Zone
Our analysis of the Ethereum chart revealed that the $1,600-$1,650 range is still an important one for traders. The ETH price has retreated from the local highs above $2,300 and now is near $1,652 following a pullback of more than 30%.
No changes have occurred on the larger timeframe yet. The Ethereum cryptocurrency is below the 100-period simple moving average at $1,838.90. However, the buyers managed to ease selling pressure somewhat, although there are still some obstacles to overcome before the picture looks more positive.
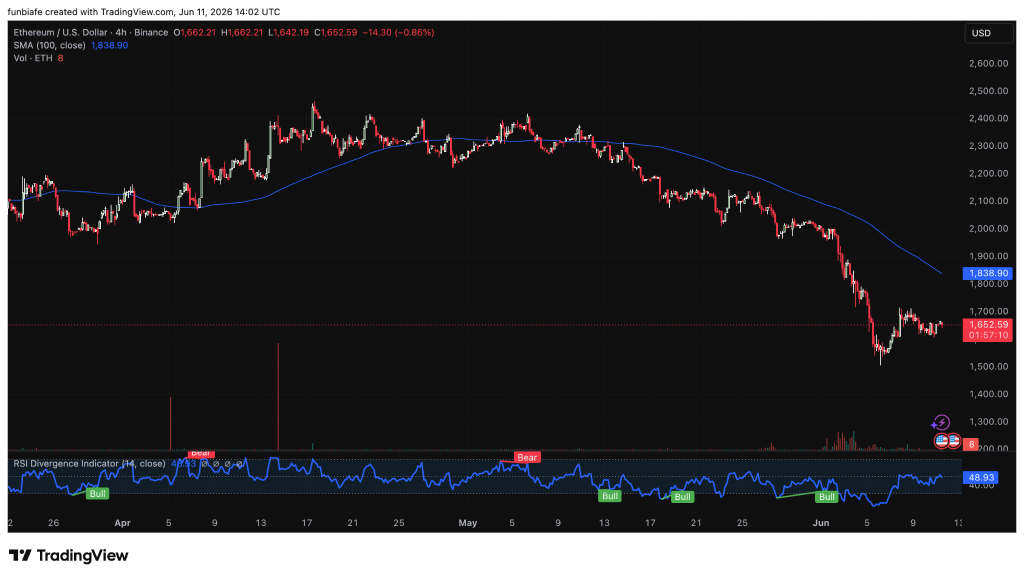
The momentum indicators reveal that the situation improved slightly. Several bullish divergences were observed in the Relative Strength Index when it was below 50. Now the indicator is closer to 48.9, which implies no reversal yet but some relief for the bulls who have been under pressure for quite some time now.
It’s time to reclaim the $1,700-$1,750 range for the buyers. This will put the 100-period simple moving average near $1,838 back on the radar again. A failure to hold above the support at $1,600 can shift focus to $1,500.
Read Also: Bitcoin And Ethereum Trading Volume Hits 2-Year Low
Tokenized Stocks Continue To Favor Ethereum
The chart is only one part of the story. Ethereum still leads the tokenized stock market with a 47.1% share of total issuance, giving it a major advantage as traditional finance expands into blockchain technology.
Such leadership was not random. The platform provides liquidity, an established development community, robust infrastructure, and a network which has been tested through several market cycles. These features ensure it will remain the go-to choice for projects looking to bring their physical world assets onto the blockchain.
The idea is simple. More tokenized stocks create more transactions, more users, and more activity across the Ethereum ecosystem. If tokenized equities grow into a much larger market over the next few years, Ethereum is already positioned at the center of that expansion.
ETH price outlook
The ETH price continues to trade below significant resistance zones and hence the overall outlook is bearish. Currently, support in the range of $1,600 to $1,650 is being held but positive RSI divergence is indicating a short-term bounce back if buyers manage to hold this support.
The first test comes near $1,700–$1,750, followed by the 100-period moving average around $1,838. A move through those levels would strengthen the recovery case. Beyond the chart, Ethereum’s 47.1% share of tokenized stock issuance gives the network a strong fundamental story.
FAQs
Subscribe to our YouTube channel for daily crypto updates, market insights, and expert analysis.