XRP Price Wipeout Leaves Traders Deeply Underwater, But There’s a Rare Buy the Dip Opportunity


XRP price dipped another 1% today and now trades around $1.33. The token has lost more than half its market value since last summer. Short-term traders are feeling the pain.
But Santiment just released data indicating that this may be a rare buying opportunity. The average XRP trader active in the past 30 days is down 47%. Many are selling at the bottom. Historically, such extremes have preceded strong rebounds. Let’s dig into the numbers.
What you'll learn 👉
Santiment: MVRV at 5-Year Low, Fear at Rare Extremes
Santiment reports that XRP’s 30-day MVRV (Market Value to Realized Value) has fallen to its lowest level since December 2020. The average trading return for active traders is -47%.
MVRV measures unrealized profits or losses of short-term holders. When it drops this low, it means panic selling has likely exhausted. Historically, MVRV averages out to 0% over time.
Being this deep in the red suggests an extreme undervalued zone.
The chart shows that similar MVRV lows in the past preceded strong rebounds. Despite the price wipeout, patient investors still have reasons for optimism: regulatory progress (CLARITY Act), ETF speculation, and Ripple’s long-term adoption narrative.
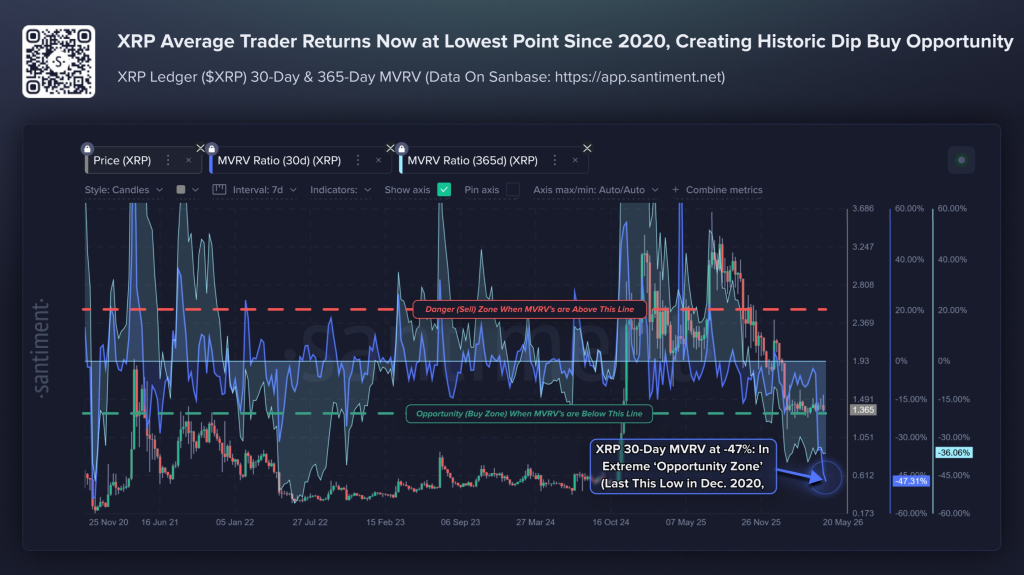
XRP rallied aggressively in late 2024 and early 2025, leaving many traders buying near local tops. Repeated selloffs pushed short-term holders deeply underwater.
The deeply negative MVRV zone tends to appear when retail traders have largely given up. That creates conditions where even small positive catalysts can trigger sharp recoveries.
Weak MVRV readings alone do not guarantee a reversal, but they signal that downside risk is more limited compared to potential upside.
Read also: XRP Price Prediction if the CLARITY Act Gets Delayed to 2027
XRP Price Analysis – 4-Hour Chart and Sentiment
We also tracked Santiment’s social sentiment data yesterday. The ratio of positive to negative comments about XRP fell to approximately 1.1 on May 25 – just above the FUD threshold. That is the lowest reading since early May.
The XRP price chart shows previous dips into the FUD zone (around April 24-28, May 1, and May 13) were all followed by price stabilization or short-term bounces. Conversely, when the ratio climbed into the FOMO zone above 1.5, XRP often topped shortly after.
The current sentiment is fearful, which historically has been a good time to accumulate.
Now let’s look at the attached 4-hour XRP chart (from Coinbase). Key observations:
- Current price: 1.3294, down 0.29%.
- 200-period moving average: $1.6689 – far above current price. This is a major resistance level. Until XRP closes above it, the trend remains bearish.
- RSI (14): 40.01 – bearish territory but not oversold (30 would be oversold). Momentum is weak.
- Support: 1.30 psychological level, then 1.26 (previous low).
- Resistance: 1.38 (recent high), then 1.42, then the 200-MA at $1.67.
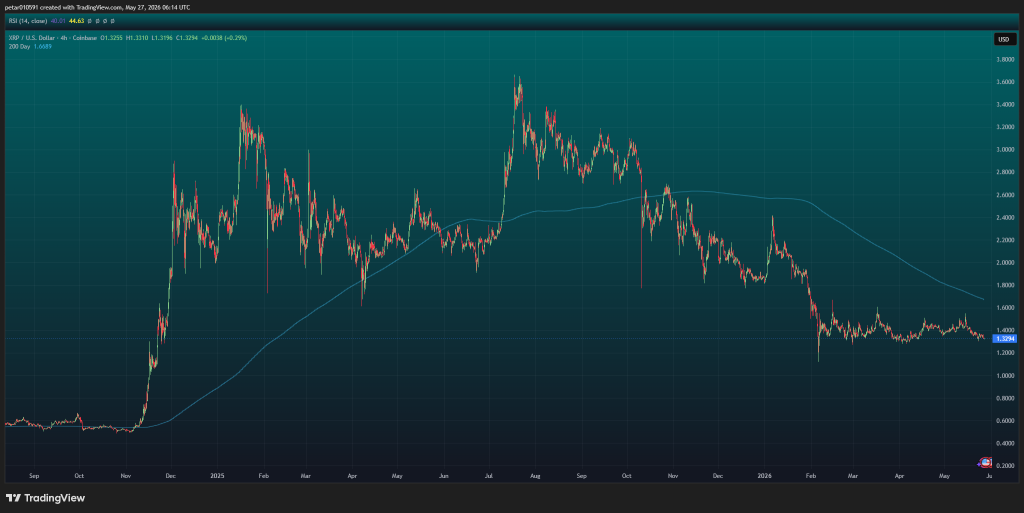
The 4-hour structure shows a descending channel. Price has been making lower highs since the $1.55 peak in mid-May. Volume is low. No reversal signal yet.
XRP Price Outlook
The MVRV data is a strong long-term bullish signal. When short-term traders are down 47% on average, the selling pressure tends to dry up. The social sentiment FUD zone also supports a contrarian buy case.
However, the technical chart shows a weak structure. XRP needs to hold 1.30 support to avoid a drop to 1.26 or even 1.20. A break above 1.38 would be the first sign of strength.
For patient investors, the 1.30-1.33 range has historically been a good accumulation zone based on MVRV extremes. The CLARITY Act and ETF inflows could act as catalysts.
Short-term traders may wait for a confirmed bounce above $1.38. The risk-reward favors the upside over a 3-6 month horizon, but the immediate trend remains fragile.
FAQs
Subscribe to our YouTube channel for daily crypto updates, market insights, and expert analysis.