
Crypto Price Prediction for Today, August 2: XRP, Ethereum (ETH), Worldcoin (WLD)


August is off to a decent start. The whole crypto market is up a little over half a percent in the last day, now at $2.18 trillion. What turned things around is that Trump called off those planned strikes on Iran, and that took some of the edge off. People got less nervous, the Bitcoin price started moving up again, and that pulled the rest of the market with it.
On top of that, open interest in derivatives dropped, which is actually good news. It means there’s less risk of those big forced sell-offs that hurt prices last week. And traders are feeling better too, dipping their toes back into riskier assets.
So does this little bounce keep going and turn into something bigger? Or does it fizzle out and lead to more selling? Let’s look at what the charts are showing for XRP, Ethereum, and Worldcoin.
What you'll learn 👉
XRP Price Eyes $1.10 as ETF Demand and XRPL Upgrade Lift Sentiment
Ripple’s XRP is at $1.08, up about 2% in the last day. We pulled up the chart and here’s what stood out, after that dip down to $1.05, buyers jumped in and pushed it back over that short-term wall around $1.08.
That move also keeps XRP above that $1.00 line, which has been a magnet for buyers over the past couple weeks. People seem to like it there.
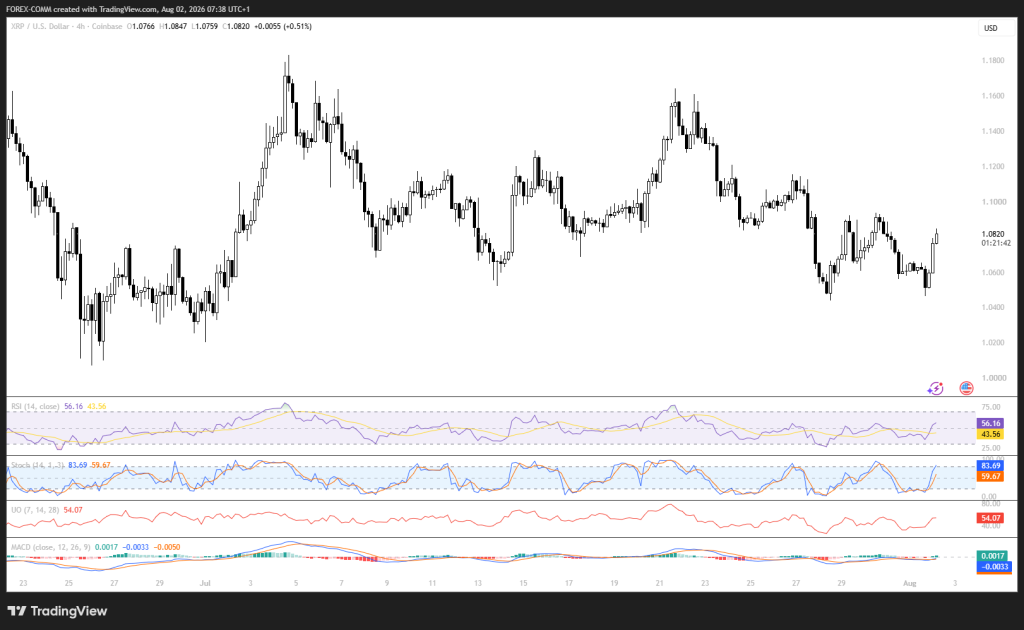
Things are looking better than they did at the end of July. The RSI is up to 56.16, above that neutral 50 mark, which tells us buyers are starting to take control again. The Ultimate Oscillator is at 54.07 too, so buying pressure is picking up, but we’re not in crazy territory yet.
One thing to watch: the stochastic oscillator has shot up to 83.69. That’s overbought territory. Usually that happens when a recovery picks up steam, but it can also mean some folks might take profits if the XRP price can’t push higher.
The MACD just flipped positive at 0.0017, which backs up the recovery story. But here’s the catch, XRP still has to get past that $1.10–$1.12 zone first. And $1.15 is the big one bulls really need to crack.
| Indicator | Reading | Interpretation |
|---|---|---|
| RSI (14) | 56.16 | Buyers hold a modest advantage |
| STOCH (9,6) | 83.69 | Overbought, strong momentum |
| Ultimate Oscillator | 54.07 | Buying pressure improving |
| MACD | 0.0017 | Bullish crossover |
Key Factors Pushing the XRP Price Presently
Investors are keeping an eye on the XRPL v3.3.0 upgrade coming in early August. It brings a bunch of new features, Confidential MPT, Batch Transactions, Permission Delegation, Sponsored Fees, and Dynamic MPT. All of that is meant to make tokenization easier and open the door for more institutional use.
On the ETF front, XRP funds have pulled in about $1.4 to $1.5 billion in net inflows since November 2025. Seven funds now hold roughly 970 million XRP combined.
Ripple got another confidence boost too. SBI just valued its Ripple stake at $41.2 billion, which says a lot about how the company is doing behind the scenes.
And one more thing, Banx Network confirmed that MEXC Learn is going to start putting out XRP Ledger content on August 10. That should give the whole ecosystem a little more exposure.
XRP Price Prediction for Today
Bullish Prediction:
A move above $1.10 could open the door to $1.12, with $1.15 becoming the next target if buying volume continues to improve.
Neutral Prediction:
The XRP price could trade between $1.06 and $1.10 as traders wait for fresh news surrounding the XRPL upgrade.
Bearish Prediction:
Losing $1.05 support would place $1.02 in focus. A break below that level could send Ripple’s XRP price back toward the $1.00 psychological support.
Ethereum Price Holds Near $1,900 as Institutions Increase Exposure
The Ethereum price trades at $1,875.59, up 1.75% today. We had a look at the chart and found the recovery from Friday’s decline has brought ETH back toward the middle of its trading range. Buyers defended the area around $1,840, preventing a deeper decline.
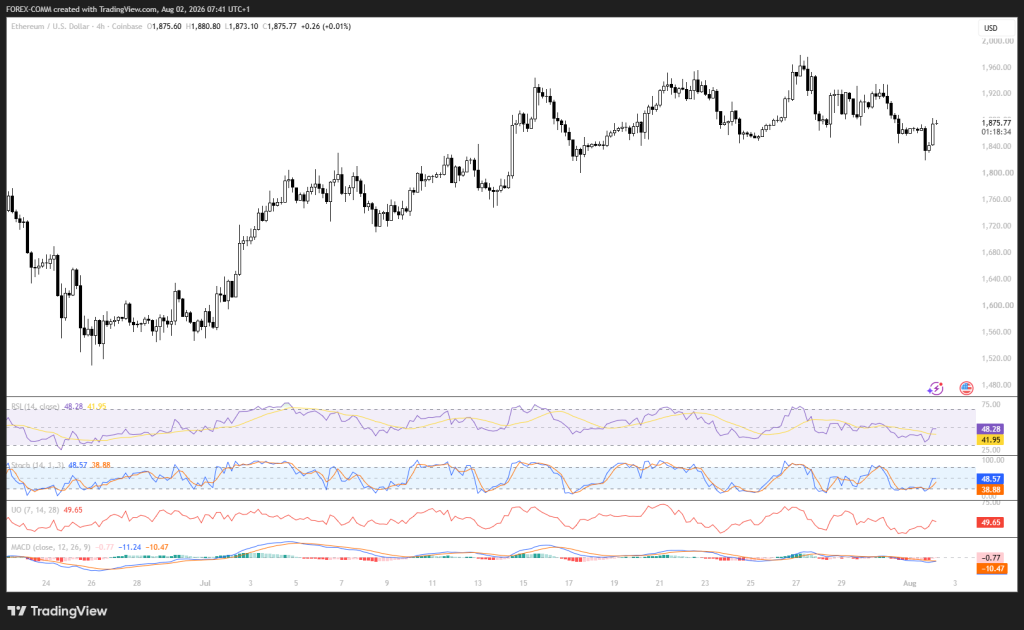
Momentum remains balanced. The RSI is at 48.28, just under that neutral 50 line. The Ultimate Oscillator is at 49.65, so basically, nobody’s really in charge right now. Buyers and sellers are pretty evenly matched.
The stochastic oscillator has bounced back to 48.57 after spending some time down near oversold levels. That tells us momentum is getting a little better, but buyers need to show up with more volume before they can take another run at that $1,920–$1,950 wall.
The MACD is still negative at -0.77, so bearish pressure hasn’t completely let up. But here’s something worth noting, the histogram is starting to flatten out. That usually happens right before momentum starts turning around.
| Indicator | Reading | Interpretation |
|---|---|---|
| RSI (14) | 48.28 | Neutral |
| STOCH (9,6) | 48.57 | Recovery from oversold levels |
| Ultimate Oscillator | 49.65 | Balanced momentum |
| MACD | -0.77 | Bearish momentum easing |
Key Factors Pushing the Ethereum Price Presently
Morgan Stanley just rolled out the Morgan Stanley Ethereum Trust, MSSE for short. It’s a spot Ethereum ETF that actually stakes part of its ETH and passes those staking rewards right back to investors.
The fee is 0.14%, which is pretty reasonable. And the best part is both big institutions and everyday retail investors can get staking yields without having to run their own validators. No tech setup, no headaches, just exposure and rewards.
Institutional demand also remains healthy. Fidelity transferred about 260,000 ETH, worth nearly $500 million, into custody wallets without sending coins to exchanges. Spot Ether ETFs also recorded $9.03 million in net inflows on July 31 even as spot Bitcoin ETFs lost $265.4 million, pointing to stronger relative demand for Ethereum.
Related Ethereum News: Ethereum Price Has 2 Doors: Will ETH Price Reach $1,000 or $10,000 First?
Ethereum Price Prediction for Today
Bullish Prediction:
A break above $1,900 could send the Ethereum price toward $1,920, with $1,950 becoming the next resistance.
Neutral Prediction:
The ETH price could remain between $1,850 and $1,900 as traders monitor ETF flows and institutional activity.
Bearish Prediction:
Losing $1,840 support could expose $1,800, with additional weakness opening the door toward $1,760.
Worldcoin Price Jumps 7% as Institutions Increase Exposure
Worldcoin is at $0.3221, up 7% in the last day. We pulled up the chart and the token has been trying to bounce back after hanging above that $0.30 support zone for a few sessions. Buyers showed up around that level and gave it a nice push. That daily move is actually the strongest we’ve seen from the WLD price in over a week.
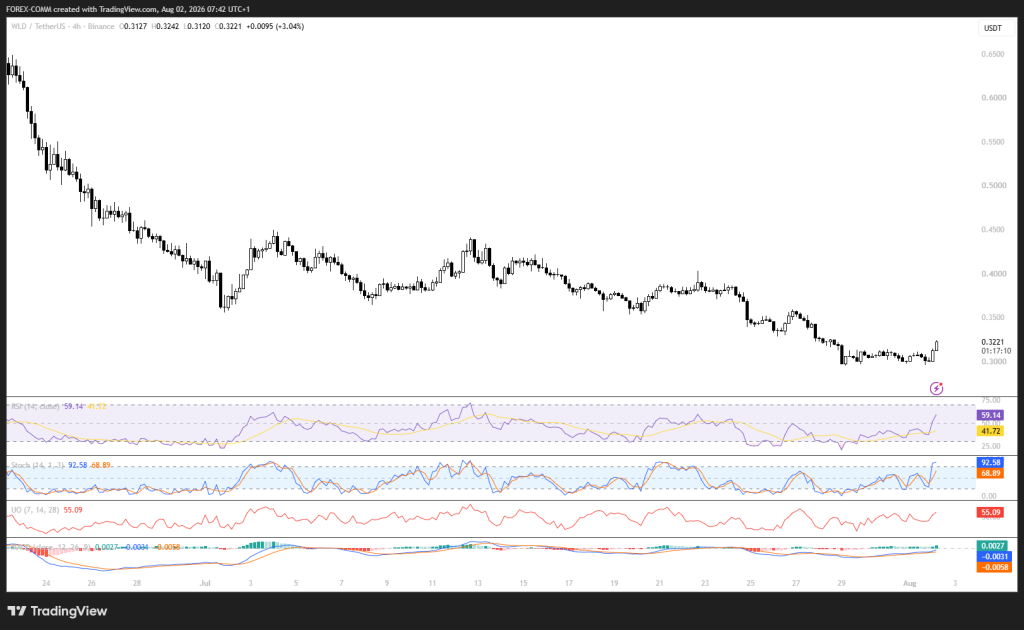
The indicators are looking better across the board. The RSI is up to 59.14, well above that neutral 50 line, so buyers are definitely in control for now. The Ultimate Oscillator is at 55.09 too, which backs that up and shows buying pressure is improving.
One thing to keep an eye on: the stochastic oscillator just shot up to 92.58. That’s deep in overbought territory. Strong runs often push it that high, but it also means we could see some folks take profits if buying starts to slow down.
The MACD is still slightly negative at -0.0031, but the histogram has been getting better over the last few sessions. That’s a good sign.
Here’s the key levels to watch, if the Worldcoin price can push past $0.33, that would strengthen the recovery and open the door to $0.35 next. But if buyers can’t hold above $0.32, we could see it drift back down toward that $0.30 support zone.
| Indicator | Reading | Interpretation |
|---|---|---|
| RSI (14) | 59.14 | Buyers have the advantage |
| STOCH (9,6) | 92.58 | Strong momentum, overbought |
| Ultimate Oscillator | 55.09 | Buying pressure improving |
| MACD | -0.0031 | Bearish momentum fading |
Key Factors Pushing the Worldcoin Price Presently
Institutional interest has strengthened after Eightco Holdings disclosed ownership of 301.97 million WLD, valued at about $109 million at current prices.
The position represents roughly 8% of Worldcoin’s circulating supply and forms part of the company’s digital identity strategy. Also, Worldcoin reduced its daily token unlock rate from 5.1 million to 2.9 million WLD, a 43% cut that eases future selling pressure.
Market access has also improved. Robinhood Crypto’s Bitstamp platform added support for WLD trading, increasing liquidity and retail accessibility. Investors are also watching optimism surrounding a potential spot Worldcoin ETF after Grayscale’s filing, though that remains an early-stage narrative with no approval timeline.
Worldcoin Price Prediction for Today
Bullish Prediction:
If the Worldcoin price clears $0.33, buyers could target $0.35. A sustained break above that level may open the door to $0.37.
Neutral Prediction:
Holding above $0.31 could keep the Worldcoin price trading between $0.31 and $0.33 as traders digest the latest institutional developments.
Bearish Prediction:
A break below $0.30 would weaken the short-term recovery and could send the Worldcoin price toward $0.29. Losing that support would expose $0.27 next.
Frequently Asked Questions
Subscribe to our YouTube channel for daily crypto updates, market insights, and expert analysis.






