Crypto markets stayed relatively calm during the early hours of May 9, 2026, though several altcoins continued pushing higher after strong moves earlier this week. Pepe kept climbing slowly from its March lows, XRP struggled to clear a major resistance zone again, and Sui continued extending a breakout that started yesterday.
A closer look at the charts shows three very different setups forming across PEPE, XRP price, and Sui price today. PEPE still trades inside a steady upward structure, XRP remains trapped below resistance, and SUI now faces a key test after breaking out of a triangle pattern.
What you'll learn 👉
PEPE Price Continues Climbing Slowly Toward Another Resistance Test
PEPE price has been moving gradually higher since the end of March. The Pepe meme coin traded close to $0.00000317 during that period, though the price has now recovered toward $0.00000433 at the time of writing.
That recovery remains important because the structure still shows higher lows forming across the chart. Buyers have continued defending pullbacks during recent sessions.
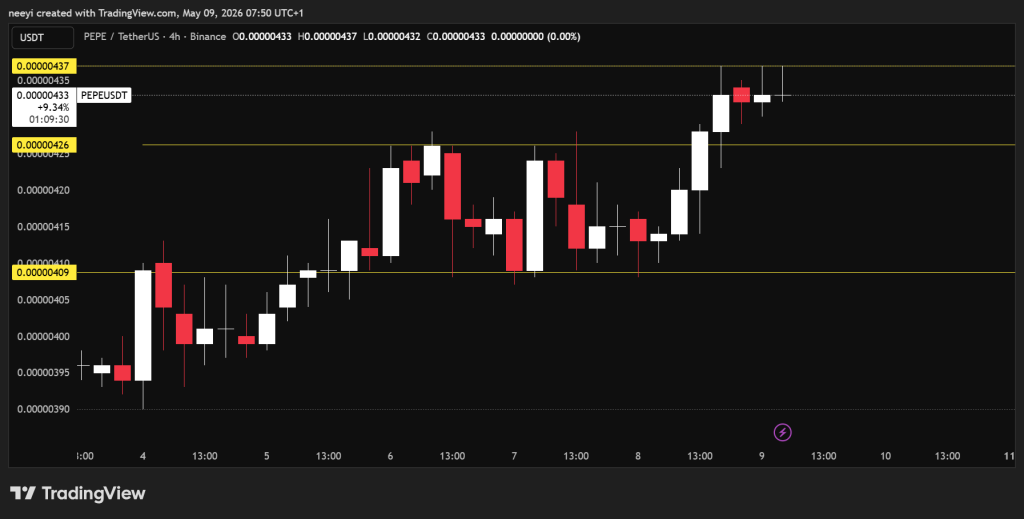
The first resistance level for today remains yesterday’s high near $0.00000437. A successful move above that level could open the path toward the next target around $0.00000448.
Support remains strong near $0.00000426. A breakdown below that zone could expose the next downside target near $0.00000409.
The RSI reading currently sits at 71.637. That reading still supports bullish pressure, though it also shows PEPE price entering slightly overheated territory after several days of upward movement.
The stochastic indicator currently reads 68.359. That indicator still supports buying strength because momentum remains tilted upward across shorter timeframes.
MACD currently stays neutral around 0. That reading shows momentum slowing slightly after the recent upward move.
The Ultimate Oscillator currently reads 49.161. That level shows neither strong bullish pressure nor heavy selling pressure at the moment.
Bull/Bear Power currently remains neutral around 0. That reading shows buyers still defending the market, though strong dominance has not appeared yet.
| Name Of Indicator | Metrics | Interpretation Of Reading |
|---|---|---|
| RSI (14) | 71.637 | Bullish |
| STOCH (9,6) | 68.359 | Bullish |
| MACD (12,26) | 0 | Neutral |
| Ultimate Oscillator | 49.161 | Neutral |
| Bull/Bear Power (13) | 0 | Neutral |
PEPE Price Prediction for Today
The bullish scenario for PEPE price requires a break above yesterday’s high near $0.00000437. A successful breakout could push the Pepe meme coin toward the next resistance near $0.00000448.
The neutral scenario could keep PEPE trading between $0.00000437 and $0.00000426 throughout today’s session.
The bearish scenario appears if support around $0.00000426 breaks. That move could expose lower support near $0.00000409.
XRP Price Faces Another Major Test Near $1.43 Resistance
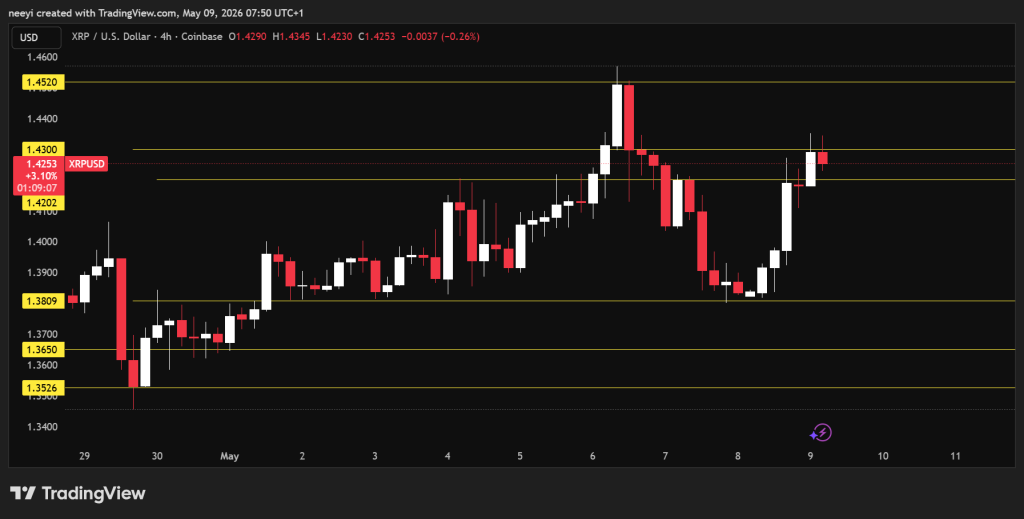
XRP price reached the top resistance target around $1.43 yesterday, though the market failed to break through that level successfully.
The rejection remains important because XRP still trades below that resistance zone at the time of writing. A successful breakout above $1.43 could push XRP price toward $1.452 afterward.
Immediate support currently remains close to $1.42. A breakdown below that zone could drag XRP price back toward the higher areas of the $1.3 range during the weekend.
The RSI reading currently stands near 54.9. That level shows balanced momentum because XRP price still trades between bullish and bearish territory.
The stochastic indicator currently reads 55.382. That reading still favors buyers slightly because short term momentum remains positive.
MACD currently shows a buy signal around 0.007. That reading supports the possibility of another upward attempt near resistance.
The Ultimate Oscillator currently reads 42.928. That reading leans slightly bearish because buying pressure weakened after the rejection near $1.43.
Bull/Bear Power currently reads 0.0391. That reading still supports buyers because the market remains slightly above equilibrium.
| Name Of Indicator | Metrics | Interpretation Of Reading |
|---|---|---|
| RSI (14) | 54.9 | Neutral |
| STOCH (9,6) | 55.382 | Bullish |
| MACD (12,26) | 0.007 | Bullish |
| Ultimate Oscillator | 42.928 | Bearish |
| Bull/Bear Power (13) | 0.0391 | Bullish |
XRP Price Prediction for Today
The bullish scenario for XRP price depends on a break above the $1.43 resistance level. That move could open the possibility of XRP reaching $1.45 afterward.
The neutral scenario may keep XRP price trading between resistance near $1.43 and support around $1.42 throughout today.
The bearish scenario becomes possible if XRP price breaks below $1.42. That breakdown could expose lower levels inside the $1.3 range.
Sui Price Breakout Places Focus on the $1.156 Resistance Level
Sui price completed a breakout from a triangle wedge pattern yesterday after weeks of consolidation that started back in April.
The breakout pushed SUI higher immediately afterward. The next important resistance now sits close to $1.156.
A successful move above that level could strengthen the breakout structure further. That setup may allow Sui price to continue climbing during today’s session.
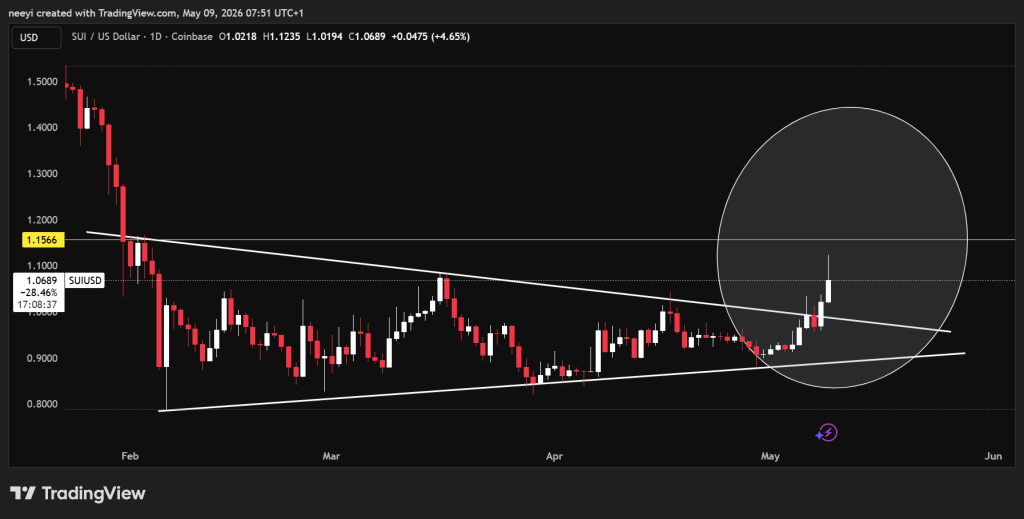
Another possibility still deserves attention because retracements often appear after breakout moves. SUI could retest the broken triangle pattern before another upward attempt begins.
A failed support retest could push the price back inside the triangle pattern again.
The RSI reading currently stands at 70.471. That level supports bullish momentum, though the market also looks slightly stretched after the breakout.
The stochastic indicator currently reads 48.165. That reading remains neutral because momentum still lacks strong directional confirmation.
MACD currently reads 0.023 with a buy signal active. That setup still supports continued upside pressure.
The Ultimate Oscillator currently stands at 53.426. That reading supports moderate bullish pressure across multiple timeframes.
Bull/Bear Power currently reads 0.1748. That reading shows buyers still controlling short term momentum after the breakout.
| Name Of Indicator | Metrics | Interpretation Of Reading |
|---|---|---|
| RSI (14) | 70.471 | Bullish |
| STOCH (9,6) | 48.165 | Neutral |
| MACD (12,26) | 0.023 | Bullish |
| Ultimate Oscillator | 53.426 | Bullish |
| Bull/Bear Power (13) | 0.1748 | Bullish |
SUI Price Prediction for Today
The bullish scenario for Sui price requires a break above $1.156. That move would fully confirm the triangle breakout structure and strengthen bullish control.
The neutral scenario could keep SUI trading between $1.156 and the top of the broken triangle pattern near $1.0.
The bearish scenario becomes possible if SUI breaks below $1.0. That move could send the price back inside the broken triangle pattern again.
FAQs
Subscribe to our YouTube channel for daily crypto updates, market insights, and expert analysis.