
Kaspa, XRP, and Solana are all sitting at key levels today, and the lack of strong movement over the past few days has created a quiet tension across their charts.
KAS remains locked in a tight range with no clear breakout yet, XRP has started to slip after failing near resistance, and SOL is now testing an important support within its rising structure.
These setups often precede sharper moves, which makes today’s price action worth watching closely as each asset edges closer to a potential decision point.
What you'll learn 👉
Kaspa Price Consolidation Keeps KAS Stuck Within Tight Range
Kaspa price has remained quiet over the past 6 days, moving sideways within a narrow band between $0.034 and $0.0353. A closer look shows an even tighter zone between $0.0340 and $0.0349, where price continues to rotate without strong conviction.
This type of structure often signals a pause before expansion. A decisive move above $0.0349 could open the door toward $0.0395, although a reaction near the descending triangle resistance may slow that move. A failure to hold $0.0340 could push price lower toward $0.0334.
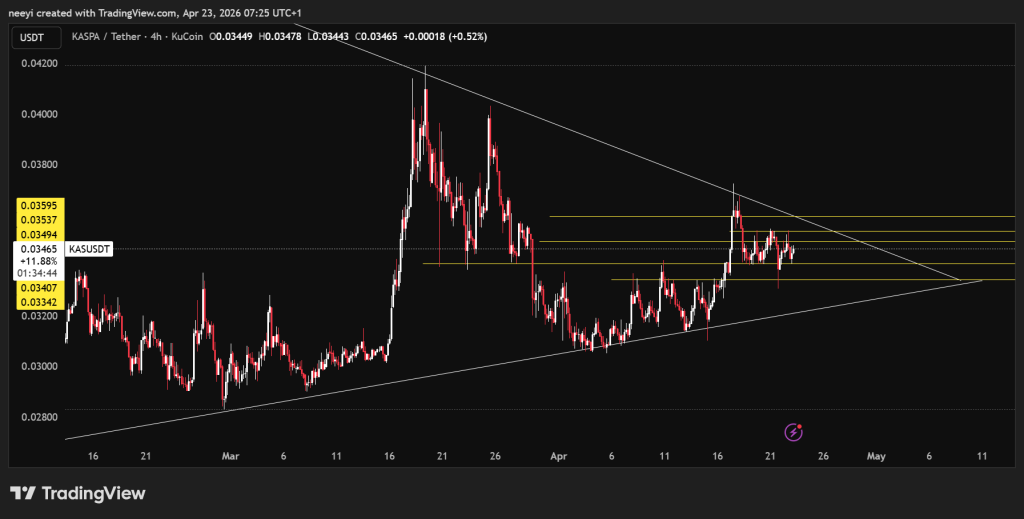
A look at the 4 hour chart shows Kaspa trading above both the 7-period and 30-period moving averages, which sit at $0.03459 and $0.03458. That setup suggests buyers have started to regain short-term control.
RSI sits at 52, which leaves room for movement in either direction. The RSI-based moving average remains above price, which introduces a layer of resistance. MACD shows a slightly bearish tone, which adds caution to the outlook.
These mixed signals create a balanced setup where neither side holds full control.
| Indicator | Reading | Bullish short-term support |
|---|---|---|
| 7 SMA | $0.03459 | Bullish short term support |
| 30 SMA | $0.03458 | Bullish structure |
| RSI | 52 | Neutral momentum |
| RSI MA | Above Price | Resistance present |
| MACD | Slightly Bearish | Weak downside pressure |
Kaspa Price Prediction For Today
- Kaspa remains neutral for today, and the most likely scenario points toward continued consolidation between $0.0340 and $0.0355.
- A move above $0.0349 appears less likely at the moment, though it could push price toward $0.036 if momentum builds. A break below $0.0340 would shift focus toward $0.033.
XRP Price Faces Pressure After Rejection Near Range High
XRP price has followed a similar pattern over the past 6 days, trading between $1.39 and $1.477. Price recently moved close to $1.477 before sellers stepped in and forced a reversal.
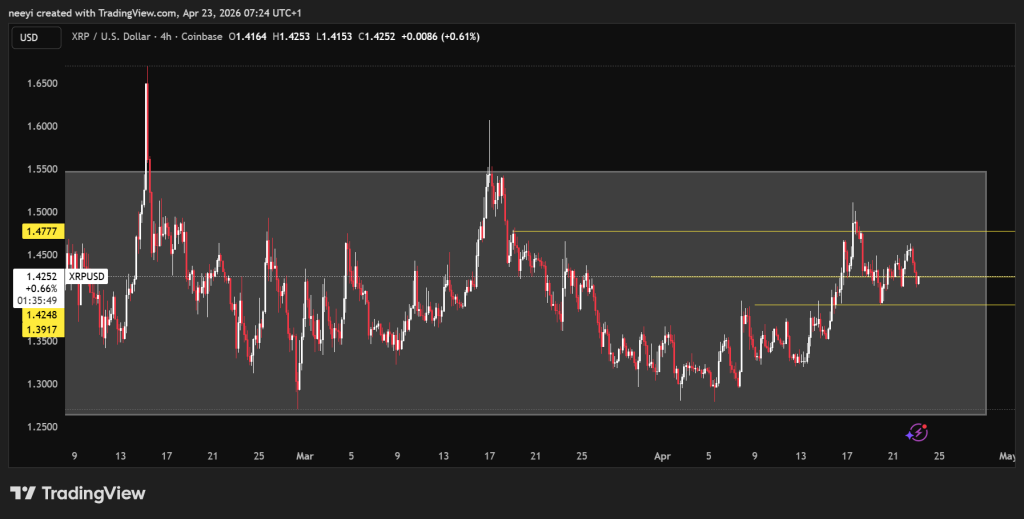
That rejection now puts pressure on the mid-range level around $1.42. Price has started to break below this zone, which increases the chances of a move toward the lower boundary near $1.39.
A look at the XRP chart shows both the 7-period and 30-period moving averages sitting above price at $1.4499 and $1.4154. This structure shows that sellers currently control the short-term trend.
RSI stands at 52 but remains below its moving average, which adds to the bearish pressure. MACD histogram has turned more negative over recent sessions, which confirms weakening momentum.
| Indicator | Reading | Interpretation |
|---|---|---|
| 7 SMA | $1.4499 | Resistance above price |
| 30 SMA | $1.4154 | Trend resistance |
| RSI | 52 | Neutral but weak |
| RSI MA | Above RSI | Bearish pressure |
| MACD | Bearish Histogram | Downward momentum |
XRP Price Prediction For Today
- The outlook for XRP price leans bearish across the next few 4 hour sessions. A move toward $1.39 now looks increasingly possible if the current breakdown continues.
- A more optimistic scenario would require price to reclaim strength and move back toward $1.477, though that outcome depends on a clear change in momentum.
Solana Price Tests Channel Support After Recent Pullback
Solana has traded inside an ascending channel since early April, which has helped maintain a gradual upward structure. Price recently faced rejection near $89 and now trades close to $85.85.
Current price action shows SOL testing support around $85.5. A break below that level could send price toward $84.9 and possibly the lower boundary of the channel if selling pressure increases. A bounce from this area could push price back toward $87 and then $89.
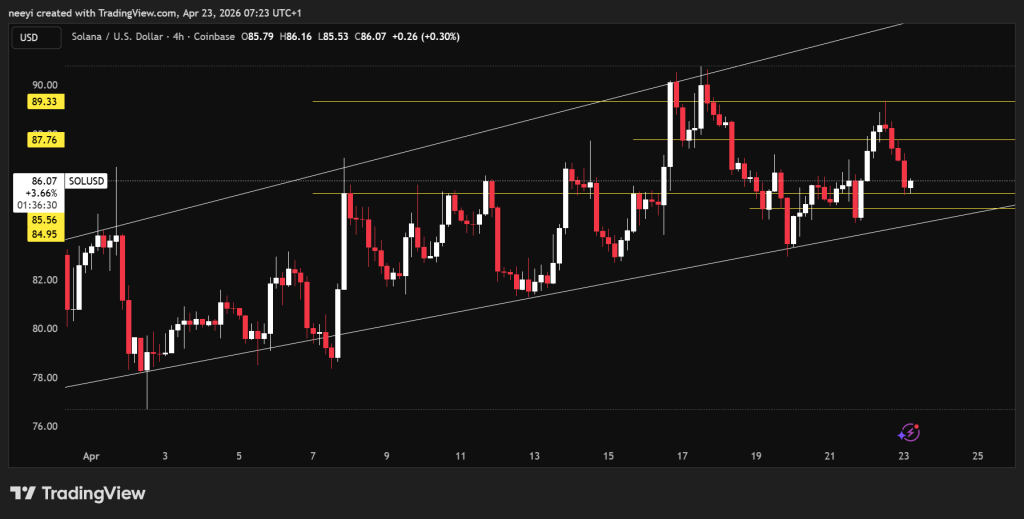
A look at the Solana chart shows the 7-period moving average at $87.2, which sits above the current price and leaves room for a recovery attempt. The 30-period moving average stands at $86.1 and acts as immediate resistance.
MACD shows a slight bullish tone, although the histogram remains weak. RSI sits at 50, and its moving average at 52 may act as resistance during any upward move.
| Indicator | Reading | Interpretation |
|---|---|---|
| 7 SMA | $87.2 | Potential upside target |
| 30 SMA | $86.1 | Immediate resistance |
| RSI | 50 | Neutral |
| RSI MA | 52 | Resistance zone |
| MACD | Slightly Bullish | Weak upside bias |
SOL Price Prediction For Today
- The bullish case for Solana depends on a strong bounce from $85.5, which could push price back toward $87 and possibly $89.
- A breakdown below $85 would weaken the structure and open the path toward $84.9 or even the base of the ascending channel.
FAQs
Subscribe to our YouTube channel for daily crypto updates, market insights, and expert analysis.