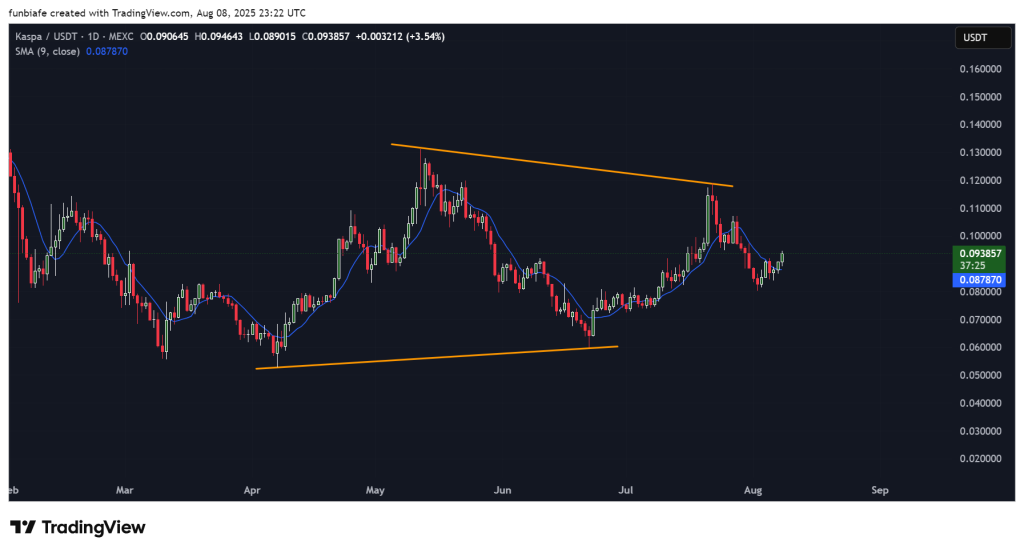
Kaspa price has been holding steady after bouncing off support, but it’s still stuck inside a tightening symmetrical triangle. The setup is leaning slightly bullish, though sellers are still putting up a fight at the top.
Earlier this month, the price dipped to the $0.085 zone before buyers stepped in. Now KAS is trading at $0.093757, sitting comfortably above its short-term moving average at $0.0879.
Let’s break down today’s setup.
What you'll learn 👉
📅 What We Got Right Yesterday
In yesterday’s prediction, we talked about how clearing $0.091 could open the door for a move toward $0.095 and even $0.10–$0.11.
That’s exactly what’s happening now. Kaspa has pushed through $0.091 and is already testing the $0.096 area, edging closer to the $0.10 mark.
We also mentioned that $0.082 was the key level to hold on the downside. Price stayed well above that, keeping the bullish structure intact.
📊 Kaspa Daily Overview (August 9)
- Current Price: $0.09375
- 24h Change: +3.54%
- RSI (14): 53.44
- Volume: Stable, with a slight uptick
Kaspa chart and indicators are still signaling a contracting wedge pattern, with higher lows meeting lower highs. Support sits near $0.080, while the top of the wedge is around $0.112–$0.120.
🔍 What the Kaspa Chart Is Showing
On the daily chart, KAS price is grinding higher but hasn’t broken out yet. The $0.096–$0.10 range is acting as the first big wall for buyers. If that goes, the next targets are $0.105–$0.110, then the key breakout zone at $0.112–$0.120.
If price slips, look for support at $0.091–$0.092, then $0.087–$0.088. A break under $0.080 would kill the bullish wedge pattern.
📈 Technical Indicators (Daily)
| Indicator | Value | Signal |
| MACD (12,26) | 0.001 | Just turned bullish |
| ADX (14) | 25.45 | Trend is strengthening |
| CCI (14) | 8.28 | Price near its average |
| RSI (14) | 53.44 | Slight bullish bias |
| ROC | -6.20 | Short-term dip in momentum |
| Bull/Bear Power (13) | 0.0016 | Buyers have a small edge |
Summary: Overall, most signals are leaning bullish, but the ROC is hinting at a bit of short-term weakness.
🔮 Kaspa Price Scenarios
Bullish Scenario:
A close above $0.10 could send KAS toward $0.105–$0.110, with a shot at breaking $0.112–$0.120.
Neutral Scenario:
If KAS price holds $0.10 as resistance, expect more sideways chop between $0.085 and $0.10.
Bearish Scenario:
Losing $0.087 could trigger a drop toward $0.084–$0.085, and possibly $0.080.
🧠 Bottom Line
Kaspa price looked stronger but still hasn’t made its breakout move. $0.10 is the big number to watch for bulls, while $0.080 is the line in the sand for bears.
Read Also: How Much Could 12,750 Kaspa (KAS) Tokens Be Worth by 2026?
Subscribe to our YouTube channel for daily crypto updates, market insights, and expert analysis.