Zcash price has just completed a breakout from a falling wedge pattern, and that move has started to change how the chart looks. Price pushed out of a prolonged downward structure and is now retesting the breakout zone, which often decides whether a move continues or fades.
That retest phase is where things become interesting. A clean hold above the breakout level could open the door to a stronger move higher. Failure to hold could pull price back into the previous range and weaken the bullish case.
The recent ZEC price move centers around a falling wedge breakout. This pattern forms when price trends lower within narrowing boundaries, which often leads to a breakout once selling pressure weakens.
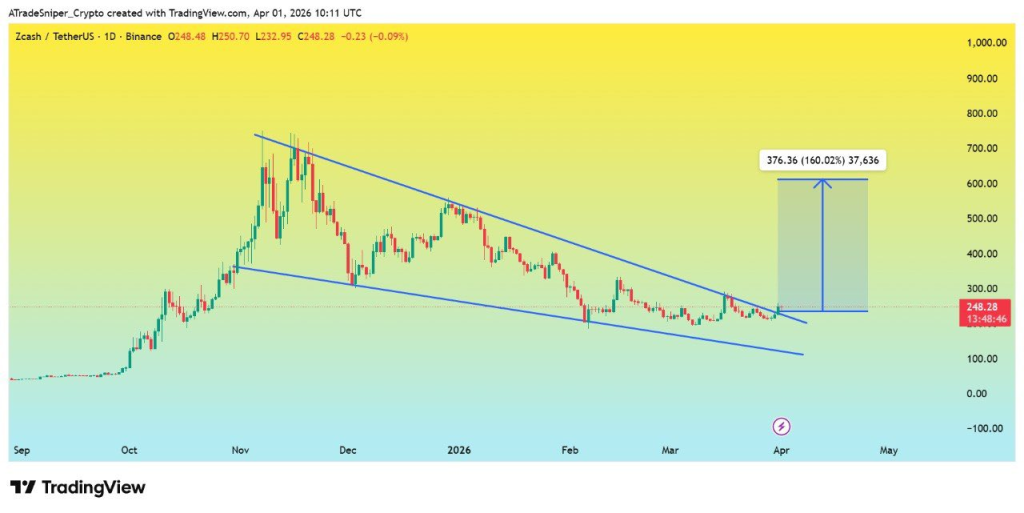
ATradeSniper pointed out that the breakout has already taken place and that price is now in the retest phase. He highlights that a successful retest could open the path toward a much larger move, with a long-term projection pointing toward $600.
That projection depends heavily on what happens next. The retest acts as a confirmation stage. If buyers defend the breakout zone and push price higher, the structure strengthens. If price slips back below the wedge, the breakout loses credibility.
That reaction reveals something important. The market has reached a decision point where structure alone suggests potential upside, yet confirmation is still pending.
Indicator Table Shows ZEC Price Still Under Strong Sell Pressure
A separate look at the ZEC chart through indicators shows a very different picture.
| Name | Value | Action |
|---|---|---|
| RSI (14) | 38.814 | Sell |
| STOCH (9,6) | 29.191 | Sell |
| MACD (12,26) | -0.004 | Sell |
| ADX (14) | 54.818 | Sell |
| Highs/Lows (14) | -0.0009 | Sell |
| Ultimate Oscillator | 36.775 | Sell |
| ROC | -14.352 | Sell |
Every major indicator on the daily timeframe still points toward a sell condition. That creates a clear contrast between price structure and momentum signals.
The Relative Strength Index sits below 40, which shows weak buying strength. It has not yet moved into a recovery zone where buyers start to dominate.
Stochastic readings remain below 30, which often aligns with oversold conditions. That may support a bounce, yet it does not confirm a reversal on its own.
MACD remains below zero, and it still trades under its signal line. That structure shows bearish momentum remains active, even if price attempts to move higher.
ADX stands above 50, which shows a strong trend environment. The issue here is that the strength belongs to the existing downtrend, not a new upward move.
Rate of Change and the Highs Lows indicator both remain negative, which confirms that recent price movement has been dominated by declines.
That combination explains the caution. The breakout exists, yet the underlying momentum has not flipped.
ZEC Price Outlook Depends On Whether Momentum Follows Structure
Zcash price now sits between two competing forces. The chart pattern points toward a potential reversal, especially if the retest holds. The indicators still show a market that has not completed its transition.
ATradeSniper maintains a bullish outlook if the retest succeeds, yet even that scenario depends on confirmation from momentum.
Read Also: How Much Could XRP Be Worth if Bitcoin Price Crashes to $45,000?
A move higher with improving RSI and a shift in MACD would strengthen the bullish case. Failure to gain that support could lead to another rejection.
Markets often show this kind of conflict near turning points. ZEC may be preparing for a larger move, or it may still need more time before momentum aligns with structure.
Subscribe to our YouTube channel for daily crypto updates, market insights, and expert analysis.