
Just like many top cryptos, XRP price has not been at its best in recent months. It has continued to struggle and has dropped around 60% from its July 2025 high near $3.6. The monthly structure still shows pressure on the downside, but some analysts continue to study historical patterns and technical wave structures to understand what may come next.
One of the boldest XRP price predictions now comes from CryptoBull (@CryptoBull2020 on X), who believes the current weakness could sit inside a much larger bullish setup.
CryptoBull compares the current XRP monthly chart to the structure seen during the 2017 bullrun. The earlier cycle shows a clear five-wave advance that began with a sharp impulse, followed by controlled pullbacks, and ended with a powerful final rally.
Each correction created space for the next upward move. That same structure now appears on the right side of the chart, though stretched across a longer period of time.
The wider projection suggests that XRP may be following the same roadmap but at a slower pace. Price already produced an initial upward move from the base and later formed a deeper retracement that CryptoBull labels as wave 2. Historical wave behavior often treats wave 2 as the phase that removes weak positioning before a stronger advance begins.
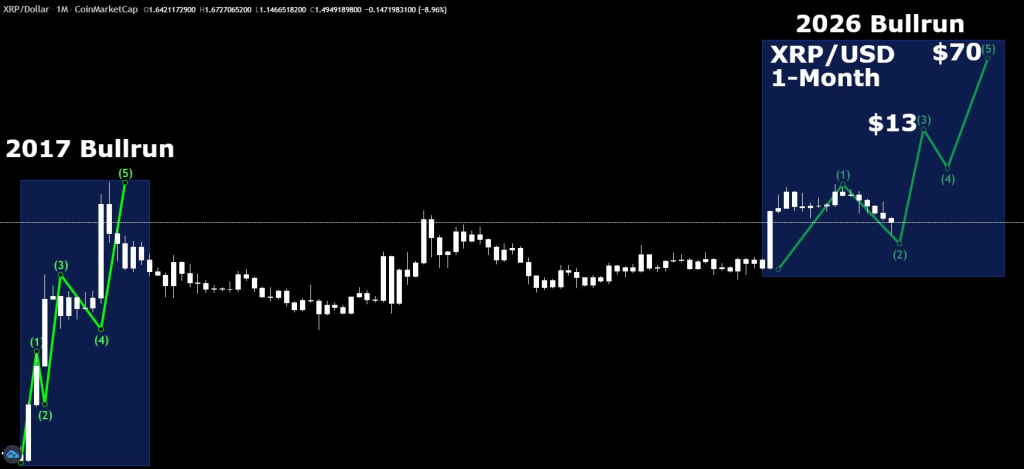
CryptoBull states that wave 2 has already completed. The recent monthly candle traded close to $1.14 before closing near $1.49, which fits the idea of a deep corrective phase. Price also remains far below the previous $3.6 region, which confirms that XRP still sits in recovery territory instead of a confirmed uptrend.
Wave positioning on the chart places wave 1 at the prior local high inside the projected range. The next swing low becomes wave 2. Technical wave theory treats this transition as the foundation for the strongest part of the cycle, commonly known as wave 3.
XRP Price Prediction Shows $13 As The Next Major Target Before A Possible Extension Toward $70
The analysis projects wave 3 as a strong upward expansion that could push XRP price toward $13 within roughly 3 months on the monthly timeframe. Each candle represents a full month of trading activity, which explains the speed of the projection once momentum returns.
The structure then shows a controlled wave 4 pullback that stays above the earlier wave 2 low, followed by a final wave 5 advance that points toward a long-range target near $70.
Read Also: Bittensor Subnets Are the Real Cheat Code – TAO Holders Might Be Missing the Biggest Edge
The roadmap remains theoretical until XRP reclaims key mid-range resistance levels and confirms stronger demand on the monthly chart.
XRP has delivered unexpected rallies in past cycles, so the coming monthly closes may decide whether this bold projection develops into reality or fades as another early-cycle hypothesis.
Subscribe to our YouTube channel for daily crypto updates, market insights, and expert analysis.