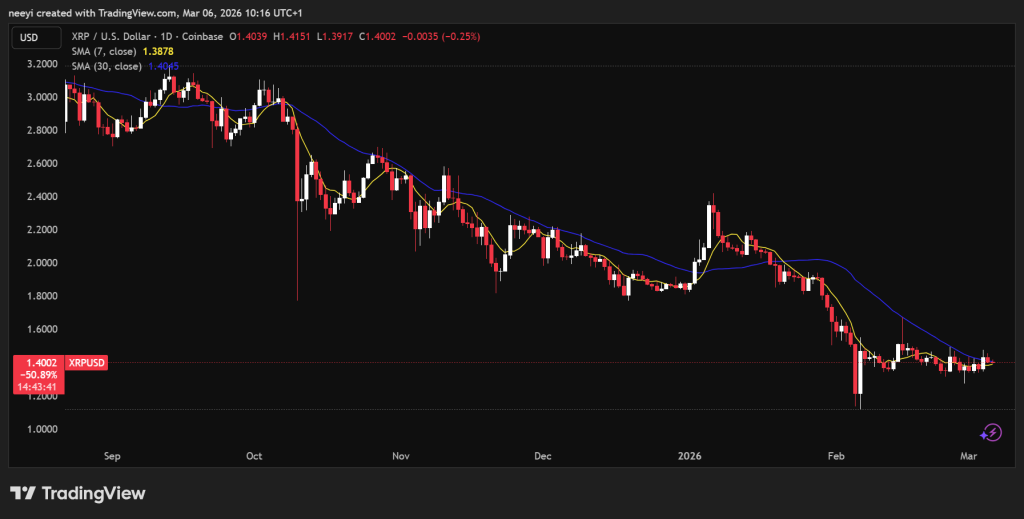
XRP trades close to $1.40 after a volatile three-month period that pushed the asset from about $1.13 to slightly above $2.10 before momentum faded. The asset now holds a market capitalization between $85 billion and $90 billion, which places it firmly among the largest cryptocurrencies in the market.
Recent price behavior shows a clear slowdown compared with the earlier rally. XRP now sits inside a consolidation phase that has developed across the past several weeks. This type of structure usually appears after a strong move when the market pauses before deciding the next direction.
Short-term trend indicators sit very close to the current price. The 7-day and 30-day simple moving averages sit roughly between $1.38 and $1.41. XRP, therefore, trades almost directly on top of its short-term averages. The longer-term trend tells a different story because the 200-day moving average sits much higher near $2.23.
Momentum indicators also show neutral conditions. Relative strength index values sit around the mid 40s. That range usually appears when markets neither push into strong buying pressure nor deep selling pressure. MACD readings remain slightly negative yet show signs of improvement.
This positioning places XRP inside a middle zone rather than near a major extreme. Markets often move sharply after such consolidation phases once a new catalyst appears.
What you'll learn 👉
Analyst Arthur Says His XRP Indicator Just Triggered Again After Similar Setup
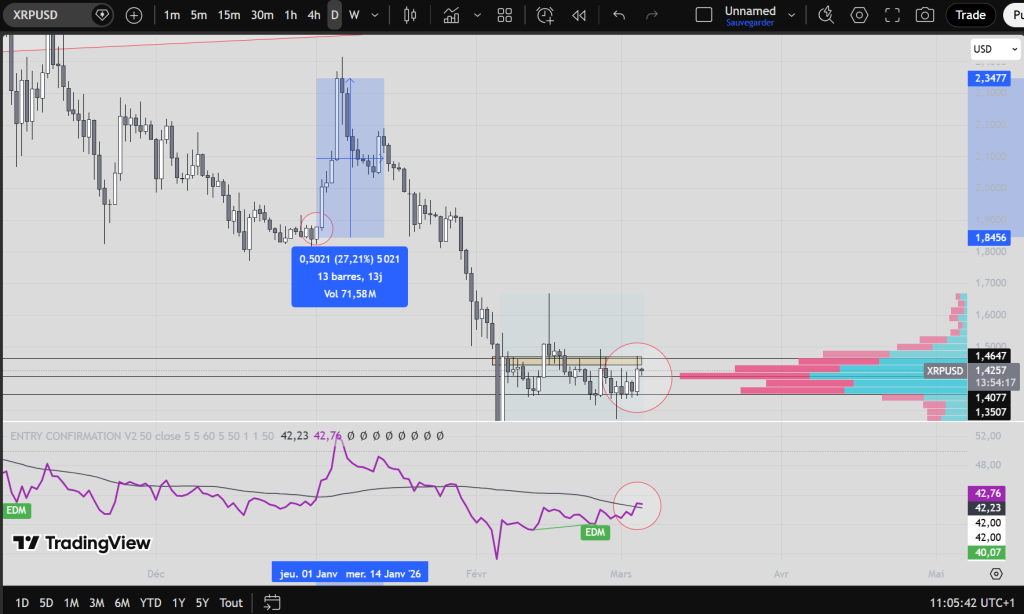
Crypto analyst Arthur, known on X as XrpArthur, recently pointed out a technical signal that caught attention among chart watchers. Arthur explained that a custom indicator on the daily timeframe has crossed its trigger line again.
Arthur highlighted the previous time this signal appeared. XRP moved roughly 27% within about four days during that earlier setup. That move began after price compressed inside a consolidation range similar to the current structure.
Arthur explained that the signal itself does not guarantee direction. The indicator simply identifies moments when market momentum begins turning upward after a cooling phase.
The analyst emphasized that several chart conditions currently resemble the previous breakout period. Consolidation, rising momentum, and nearby liquidity zones all appear at the same time.
XRP Chart Structure Shows Strong Support Holding And Liquidity Sitting Above Resistance
A look at the XRP chart helps explain the setup Arthur described. Price currently trades inside a tight range between roughly $1.35 and $1.46.
Multiple candles tested the lower portion of that range during recent sessions. Buyers repeatedly stepped in near the support area around $1.40. That repeated defense shows that demand remains present around the lower boundary.
Resistance sits slightly above the current price. The chart shows a clear barrier near $1.46 where several candles failed to close higher.
Arthur noted that liquidity often builds above consolidation ranges like this one. Traders frequently place breakout orders above resistance levels. Stop orders from short positions also tend to cluster in those zones.
Price can move quickly once that liquidity becomes active. The earlier breakout highlighted on the chart shows how fast XRP accelerated once the range finally broke.
Rising Momentum Indicator Could Signal That XRP Volatility Is About To Expand
The indicator panel on the chart shows the signal Arthur referenced in his post. The momentum line recently crossed above its trigger line again.
Arthur explained that similar crosses have appeared before several sharp XRP moves. Momentum often begins improving even before price escapes a consolidation range.
Read Also: Gold Price Dumping Every Day At 8 AM: Is Bitcoin-Style Manipulation Appearing In Metals?
This type of divergence between price compression and rising momentum can indicate that energy builds inside the market structure. Markets often remain quiet during this phase before volatility expands suddenly.
Two possible outcomes now stand out on the chart. A breakout above $1.46 could open the door toward the next resistance areas near $1.60 and $1.75. A move of similar size to the previous rally would place XRP near those levels.
A breakdown below $1.35 could send price toward deeper support zones closer to $1.20.
Subscribe to our YouTube channel for daily crypto updates, market insights, and expert analysis.