Dark Defender, one of the most vocal members of the XRP community, just posted a fresh 3-day chart analysis. His technical work carries weight. The man does not post hype without structure.
His latest tweet shows a clean breakout. The orange resistance line on the 3-day chart finally gave way. The XRP price respected the white Fibonacci support at $1.31 multiple times before making this move. That level held like a wall.
Three confirmations sit on his board:
- C Wave Complete ✅
- Resistance-Support Triangle Break ✅
- RSI Bullish Cross ✅
His conclusion: a new all-time high is in sight.
Breaking Down Dark Defender’s XRP Chart
The image he shared lays out the entire roadmap. Let’s walk through what he sees.
That level sits at the 50.00% Fibonacci retracement (marked as 1.3170 on the chart). Price tested this zone multiple times through April, May, June, and into July 2026. Each time, buyers stepped in. That repeated rejection of lower prices built a floor. Dark Defender called it support. The chart proves him right.
This diagonal descending line connected lower highs going back months. XRP pushed against it repeatedly. The 3-day candle finally closed above it. That is not a wick breakout. That is a structural break.
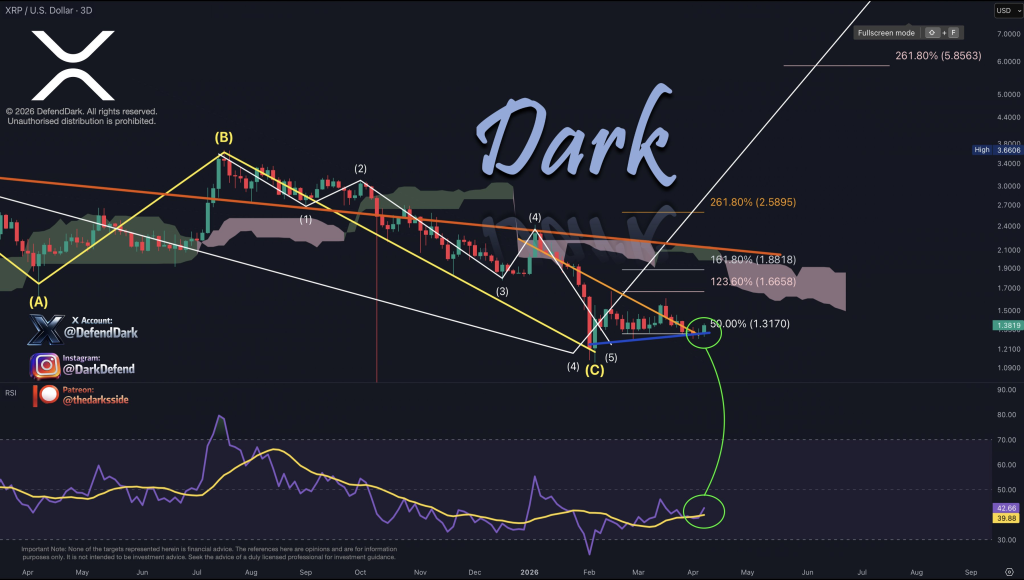
Between the white support and orange resistance, price coiled into a triangle. The tweet calls it a “Resistance-Support Triangle.” The break happened to the upside. Triangles on higher timeframes (3-day counts as high timeframe) tend to produce sustained moves.
Dark Defender follows Elliott Wave. He labeled the move from the lows as a corrective structure. With C wave complete, the entire correction is done. What comes next? The next impulse wave north. That fits the “new all-time high” call.
The RSI on his chart sits at 42.66. That is not overbought. A bullish cross typically means the RSI line moved above a signal line or above a key level like 40 or 50. The tweet confirms the cross. Momentum is turning up from a neutral zone, not from extreme highs. That leaves room for a long run.
Read also: Why SWIFT Latest Blockchain Announcement Could Slow Ripple (XRP) Adoption
What the Fibonacci Extensions Say
Dark Defender plotted multiple Fibonacci extension levels on the chart. These are not random numbers.
| Level | Price |
|---|---|
| 123.60% | $1.6658 |
| 161.80% | $1.8818 |
| 261.80% | $2.5895 |
| 361.80% (implied) | $3.6606 |
| 461.80% (implied) | $6.0000+ |
The chart also shows a label “High 3.6606” and a level at 7.0000. The 261.80% extension at $2.5895 sits just below the previous all-time high of roughly $3.40? Wait, XRP’s all-time high is $3.84 (January 2018 on CoinMarketCap) or $3.40 on some exchanges. But Dark Defender’s chart shows $7.0000 as a target. That would be a new all-time high by a wide margin.
The tweet says “a new all-time high is in sight”, not necessarily $7 tomorrow, but the structure points to a break above the old record.
Overall, Dark Defender, a vocal but high-quality analyst in the XRP community, just laid out a clear case. The 3-day chart shows a completed correction, a broken triangle, and a bullish RSI cross. His white Fibonacci support at $1.31 held multiple times. The orange resistance finally gave way.
Subscribe to our YouTube channel for daily crypto updates, market insights, and expert analysis.