XRP price is still stuck in a short-term downtrend after several failed tries to break above key resistance. Right now, it’s trading around $2.09.
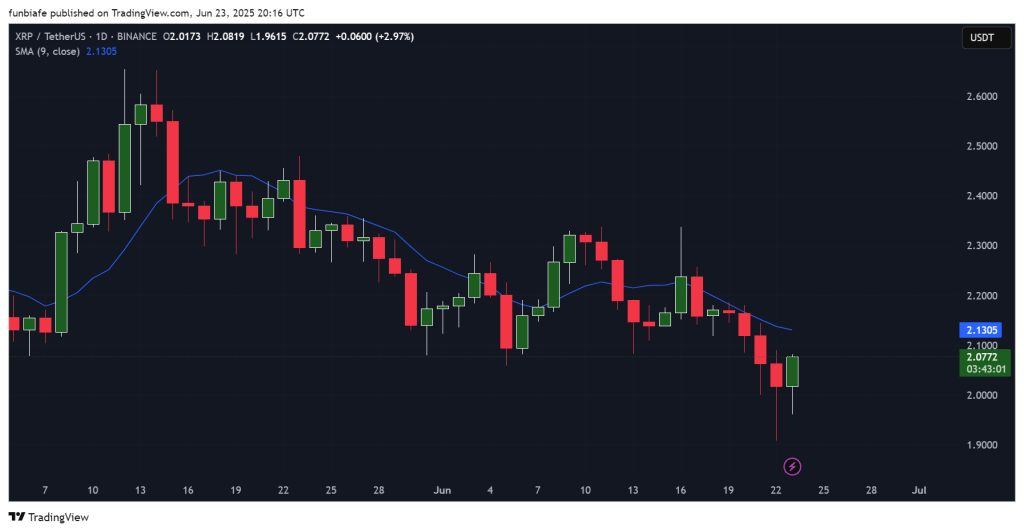
XRP dropped throughout mid-June, but on June 23 it managed a small bounce, by going from a low near $1.96 and closing around $2.08.
While the price showed a short-term reaction from support, the broader market structure remains fragile. XRP price needs a decisive break above $2.13 to shift the short-term trend.
The current rebound has not yet flipped any major resistance levels, and price action continues to unfold below the 9-day Simple Moving Average (SMA), which is acting as dynamic resistance.
Let’s take a closer look at today’s setup.
What you'll learn 👉
📅 What We Got Right Yesterday
In yesterday’s prediction, we flagged the $1.96–$2.00 zone as an immediate support range and noted that any bounce from here would likely face resistance near the 9-day SMA at $2.13.
That scenario is playing out, as XRP price did find buyers near $1.96 and pushed higher. However, as anticipated, the price remains below $2.13, which indicates that sellers are still in control. Without a daily close above this level, the bounce may lose steam.
📊 XRP Daily Overview (June 24)
- Current Price: $2.0772
- 24h Change: +2.97%
- Daily Range: $1.9615 – $2.0819
- 9-day SMA: $2.1305
The daily candle shows a long lower wick, which reflects buying pressure from the support zone. However, XRP price is still trading under a downward-sloping moving average, which continues to cap gains. Price structure shows lower highs and lower lows since mid-June.
🔍 What the XRP Chart Is Showing
XRP chart remains technically bearish. The token continues to form a declining structure with no bullish breakouts. Sellers have consistently defended the $2.13 resistance, and the previous lower high at $2.20 remains intact.
While the bounce from $1.96 shows buyer interest, this move could be a short-lived reaction unless volume and momentum support further upside.
If the price gets rejected again at the SMA, XRP may revisit the $1.96 or even $1.90 support area.
Read Also: Ripple vs SEC: Final XRP Decision Might Drag Into Late 2026 – But Is That Likely?
📈 Technical Indicators (Daily Timeframe)
| Indicator | Value | Signal / Interpretation |
| RSI (14) | 62.93 | Momentum is bullish, but not yet overbought |
| MACD (12,26) | 0.007 | Weak bullish crossover, trend shift still uncertain |
| ADX (14) | 18.531 | Trend is weak, direction not well established |
| CCI (14) | 221.5611 | Overbought, short-term correction possible |
| ROC | 2.709 | Positive momentum, price rising |
| Bull/Bear Power (13) | 0.0799 | Bulls hold slight advantage |
Summary: Indicators show mild bullish pressure. However, the overbought CCI reading and weak trend strength from ADX suggest the current rally may stall without confirmation.
🔮 XRP Price Prediction Scenarios
Bullish Scenario:
If XRP breaks above $2.15 with strong volume, a move toward $2.30 is possible. At present, this setup has not formed.
Neutral Scenario:
If the price stays between $1.88 and $2.10, XRP price may continue to consolidate sideways while awaiting a catalyst.
Bearish Scenario:
A daily break below $1.88 would likely accelerate selling. In that case, downside targets include $1.75 and $1.60.
🧠 Wrapping Up
XRP price is showing some signs of short-term relief, but it remains within a bearish trend. The $2.13 resistance is key to watch. Until that level is reclaimed, the current bounce lacks confirmation.
Traders are watching for either a breakout above $2.20 or a breakdown below $1.88 to determine the next major move.
Subscribe to our YouTube channel for daily crypto updates, market insights, and expert analysis.