XRP is trading around $2.12 right now and still can’t break out of its consolidation phase after losing steam above key resistance earlier in June.
Momentum is still looking weak, and since XRP price is hanging just above support, it’s trading with low confidence and lots of volatility.
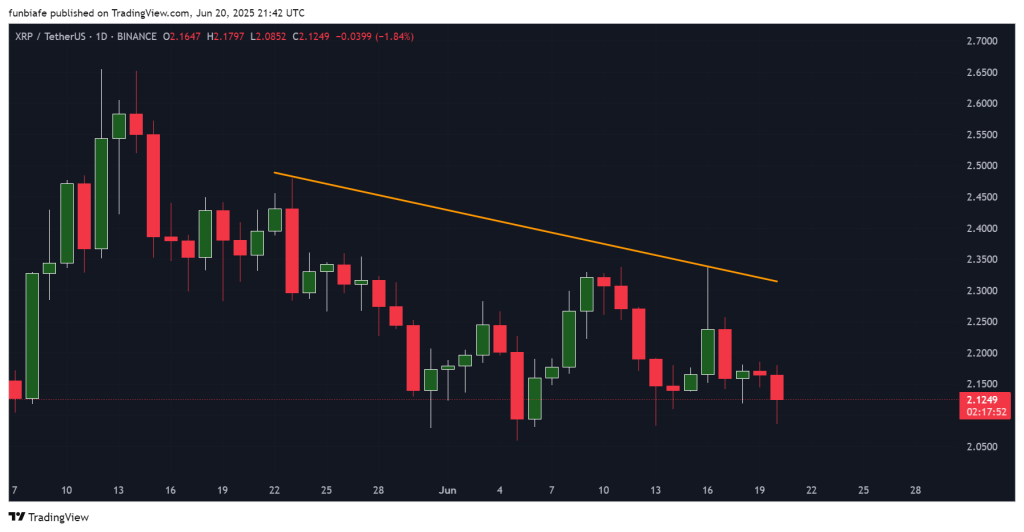
After struggling to stay above $2.20 earlier this week, XRP has now settled near $2.12. The descending trendline from late May continues to cap any rally attempts, while support near $2.08 is being tested repeatedly.
Let’s take a closer look at today’s setup.
What you'll learn 👉
📅 What We Got Right Yesterday
In yesterday’s prediction, we noted that the $2.10 support zone would likely dictate today’s direction. We also warned that failure to bounce from this zone could open the door for a move toward $2.00.
That scenario is beginning to take shape. XRP price dipped toward $2.08 and briefly recovered but is still trading well below the $2.20–$2.30 resistance zone, but it still shows weak momentum.
We also highlighted the potential for a breakout or breakdown as price continued to compress between the descending trendline and horizontal support. This setup remains valid, with no clear directional move yet confirmed.
📊 XRP Daily Overview (June 21)
- Current Price: $2.1249
- 24h Change: -1.84%
- 4H RSI (14): 37.01
- Volume: Moderate, with no surge in buying activity
XRP price continues to move sideways within a narrowing range. The $2.08–$2.10 support zone has held for now, but repeated tests are starting to weaken the base. Meanwhile, the descending trendline from late May continues to act as resistance, now sitting near $2.30.
🔍 What the XRP Chart Is Showing
The XRP chart remains firmly bearish. Price is forming lower highs and lower lows, with sellers stepping in on every minor bounce.
Candles are small and mostly indecisive, and recent rejections near $2.23 and $2.25 show the lack of momentum needed for a reversal. Until XRP price closes above $2.30 on strong volume, the trend remains in favor of the bears.
If $2.08 breaks, there’s a strong chance of testing the $2.00 level, or even the $1.95 area seen earlier this month.
📈 Technical Indicators (Daily Timeframe)
| Indicator | Value | Signal / Interpretation |
| RSI (14) | 37.01 | Bearish, approaching oversold |
| MACD (12,26) | -0.01 | Weak downward momentum |
| CCI (14) | -72.49 | Mild bearish pressure |
| Ultimate Oscillator | 49.22 | Neutral zone, undecided momentum |
| Stochastic (9,6) | 41.98 | Bearish, fading strength |
| ATR (14) | 0.0167 | volatility, larger price swings expected |
Summary: Most indicators lean bearish. RSI and MACD show weak momentum, and moving averages continue to pressure from above. ATR suggests a potential for larger moves, but direction remains uncertain.
🔮 XRP Price Prediction Scenarios
Bullish Scenario:
A break close above $2.30 with strong volume could open the way for a push to $2.40 or $2.50. No signs of this yet.
Neutral Scenario:
If that $2.08 to $2.10 support holds up, XRP price will probably keep bouncing between $2.10 and $2.30 until something breaks it out.
Bearish Scenario:
If XRP slips below $2.08, we could see it drop further, with the next support zones likely around $2.00 and $1.95.
Read Also: Here’s the XRP Price If Ripple Partners With 50+ Central Banks
🧠 Wrapping Up
XRP is still under pressure, stuck between resistance near $2.30 and support at $2.08. The charts are leaning bearish unless buyers can push it above that falling trendline.
Traders are waiting to see if XRP price can finally break out of its current range. For now, it’s just moving sideways with weak momentum.
Subscribe to our YouTube channel for daily crypto updates, market insights, and expert analysis.