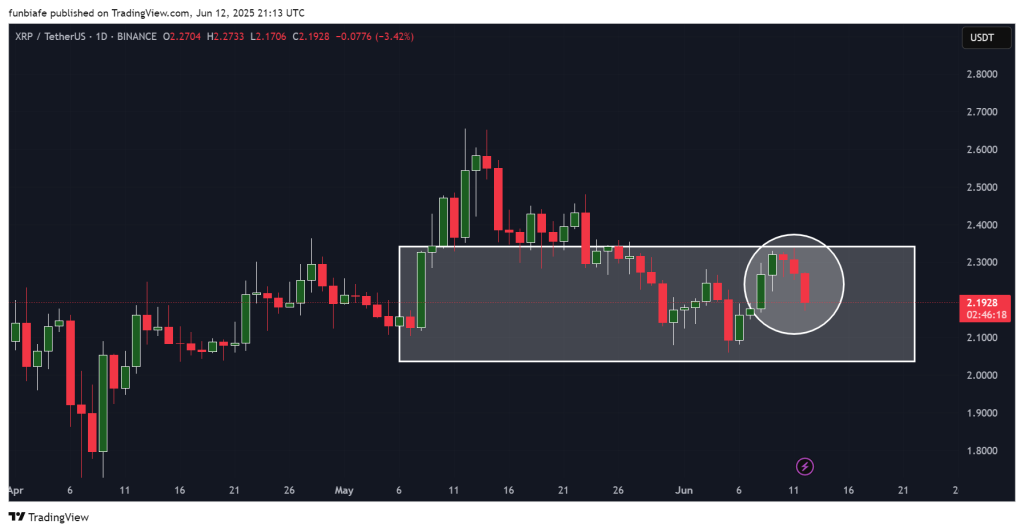
Ripple has been locked in a tight horizontal channel since early May, while trading between $2.10 and $2.30.
This aligns with the expectations from our previous XRP price prediction, where we noted that the price was likely to remain range-bound between $2.25 and $2.35 unless volume surged or a breakout catalyst appeared.
That has proven accurate so far, with XRP unable to break free from either direction. The latest price action shows sellers regaining momentum following a failed recovery attempt toward the upper boundary of the range.
A clear lower high has formed, and the most recent daily candle confirms renewed selling activity. While the $2.10 support level has held multiple times, the repeated rejections near $2.30 suggest buyer fatigue.
Let’s break down what the technical indicators are showing right now.
What you'll learn 👉
XRP Indicator Readings on the Daily Chart
| Name | Value | Action |
| RSI (Relative Strength Index) | 29.644 | Oversold territory, bearish tone |
| STOCH (Stochastic Oscillator) | 55.104 | Mild bullish crossover, early recovery |
| MACD (Moving Average Convergence Divergence) | -251.0039 | Deeply oversold, heavy selling pressure |
| CCI (Commodity Channel Index) | -251.0039 | Deeply oversold, heavy selling pressure |
| ATR (Average True Range) | 0.0171 | High volatility, sharp intraday swings |
| Ultimate Oscillator | 33.321 | Bearish reading, weak strength buildup |
The indicators suggest XRP price is under consistent downward pressure, but oversold readings on the RSI and CCI hint that a short-term bounce could develop.
The Stochastic Oscillator shows early signs of a shift, but there’s no confirmation yet. High volatility suggests price swings could intensify in either direction.
What the Moving Averages Tell Us
Looking at moving averages across the board, XRP is flashing “Sell” signals on all major timeframes. The 20-day, 50-day, 100-day, and 200-day simple and exponential moving averages are all positioned above the current price, which reflects sustained downward structure.
This alignment confirms that XRP price remains in a broader bearish trend, and any recovery attempt would first need to reclaim these levels before changing market direction. Without that shift, moving averages continue to point toward selling momentum dominating the current landscape.
Read Also: Ripple (XRP) vs Hedera (HBAR): Which Has More Upside Potential This Bull Run?
XRP Price Prediction for Today (June 13)
Bearish Case:
If XRP fails to hold the $2.10 support zone, price could slip toward the psychological $2.00 level. This would confirm a breakdown from the range and could accelerate bearish momentum, especially if volume increases.
Realistic Case:
If the horizontal channel remains intact, XRP price is likely to trade between $2.10 and $2.30 throughout the day. This would continue the current sideways consolidation, with occasional tests of both boundaries depending on broader market activity.
Bullish Case:
If XRP breaks above the $2.30 resistance zone with strong volume, a push toward $2.40 or higher becomes possible. However, such a move requires renewed buyer activity and likely a favorable shift in overall crypto sentiment.
At present, XRP structure favors further range trading. A decisive move beyond either boundary will be needed before momentum changes direction.
Subscribe to our YouTube channel for daily crypto updates, market insights, and expert analysis.

We recommend eToro
Wide range of assets: cryptocurrencies alongside other investment products such as stocks and ETFs.
Copy trading: allows users to copy the trades of leading traders, for free.
User-friendly: eToro’s web-based platform and mobile app are user-friendly and easy to navigate.