XRP price remains in the short-term pullback phase following a local top at over $3.60 last month. XRP is currently trading between $3.00 and $3.20 as investors wait to determine the next direction.
Having exploded out of a multi-week range of $2.00 to $2.50, XRP price zoomed through $3.60 before hitting resistance. Price action today is still well above the 100-day SMA, and this confirms trend strength holds.
Let’s take a closer look at today’s setup.
What you'll learn 👉
📅 What We Got Right Yesterday
In yesterday’s prediction, we highlighted three possible scenarios: a bullish continuation above $3.30, neutral ranging between $3.00 and $3.14, and a bearish case below $3.00.
As of today, the neutral scenario is playing out. XRP has remained range-bound, with XRP price bouncing between $3.00 and $3.16. Momentum cooled without triggering either a breakdown or a breakout.
We also flagged that unless volume increased or a new catalyst appeared, XRP would likely continue chopping sideways, which aligns with the current behavior.
📊 XRP Daily Overview (July 31)
- Current Price: $3.0865
- 24h Change: -1.33%
- 100-Day SMA: $2.4350
XRP price continues to hold gains above its previous breakout zone. The $3.00–$3.20 range is acting as short-term consolidation after a steep rally. Price action remains bullish in structure but paused in momentum.
🔍 What the XRP Chart Is Showing
The daily chart shows XRP price broke above a rounded-bottom accumulation zone between $2.00 and $2.50 in mid-July. The breakout triggered a sharp rally above $3.60 before a clean rejection. Price has retreated since and is consolidating.
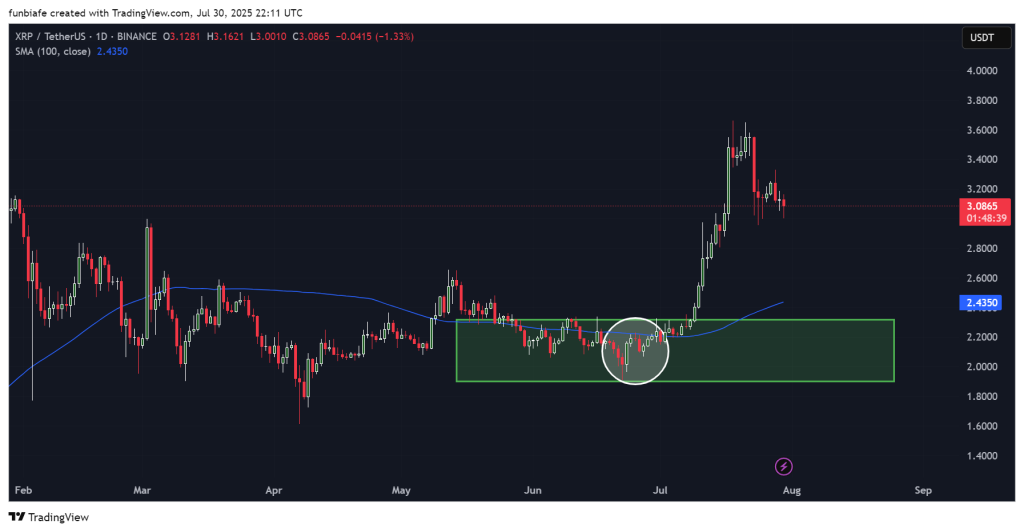
The 100-day SMA remains sloping upward and well below current price, which is conducive to additional longer-term bullish structure The $2.50–$2.60 zone is now a key support. Volume has tapered, and candles are showing indecision, which is typical of consolidation phases after strong moves.
For any bullish continuation, XRP will need to reclaim the $3.30 level and close above $3.60. A breakdown below $3.00 would leave the door open to test at $2.80 or even $2.44.
📈 Technical Indicators (Daily Timeframe)
| Indicator | Value | What It Means |
| RSI (14) | 55.47 | Moderate bullish momentum |
| ADX (14) | 53.64 | Strong trend strength |
| MACD | 0.156 | Bullish crossover, upside still valid |
| CCI (14) | -89.83 | Approaching oversold, short-term weakness |
| ROC | 1.54 | Positive momentum |
| Bull/Bear Power (13) | -0.097 | Mild bearish pressure |
Summary: Most indicators RSI, ADX, MACD, and ROC, support ongoing trend strength. However, CCI and Bull/Bear Power point to temporary seller control. Market structure remains bullish unless $3.00 fails.
🔮 XRP Price Prediction Scenarios
Bullish Scenario:
If buyers reclaim $3.30 with volume, XRP may retest $3.60–$3.80. A breakout above this could open the door to $4.00.
Neutral Scenario:
If XRP price $3.00 holds and momentum remains low, price may continue to range between $3.00 and $3.14 throughout the day.
Bearish Scenario:
A close below $3.00 on a daily basis could trigger a more precipitous drop to $2.80, or even $2.44, where there is prior support.
🧠 Wrapping Up
XRP price is still above critical moving averages and holding support levels of the breakout. While upside momentum has slowed, the bigger picture favors trend continuation in the event of buyers stepping in.
The $3.00–$3.14 area is closely monitored by traders for indications of strength or weakness. A confirmed breakdown above or below this area will likely set the tone for the remainder of the week.
Read Also: Why BlackRock, Saudi Arabia, and the IMF Are Quietly Aligning With XRP
Subscribe to our YouTube channel for daily crypto updates, market insights, and expert analysis.