XRP price is still hovering just under the $3 mark after bouncing off a key trendline, but momentum isn’t fully back on its side yet. The price action looks stuck in a narrow range, and while buyers are holding the line, they haven’t been able to push things higher.
After a failed breakout near $3.20 last week, XRP has mostly been drifting sideways. It’s now sitting around $2.99, and unless we see some strong volume soon, this consolidation might drag on.
What you'll learn 👉
📅 What We Got Right Yesterday
In yesterday’s prediction, we mentioned the importance of the $3.05 resistance zone and the $2.85 support level, which lines up with that rising trendline on the chart.
That played out exactly as expected, XRP price bounced near $2.85 and struggled to break above $3.00, just under the 9-day moving average. So far, the price has stayed in that $2.85 to $3.00 range, with no big moves either way.
We also said a break below $2.85 could send XRP toward $2.60. That hasn’t happened yet, but it’s still on the radar if support weakens.
📊 XRP Daily Snapshot (August 7)
- Current Price: $2.99
- 24h Change: +1.18%
- 9-Day SMA: $2.9952
- Volume: Low and steady
XRP price is clinging just above that key trendline support. There’s some buying pressure, but resistance near $3 and the 9-day SMA is holding strong. Until something shakes the market up, like news or a move from Bitcoin, this sideways action may continue.
🔍 What the XRP Chart is Telling Us
XRP is still technically in a bigger uptrend, thanks to that ascending trendline that’s been holding since late June. But the recent lower highs after the $3.60 top show that buyers are losing some steam.
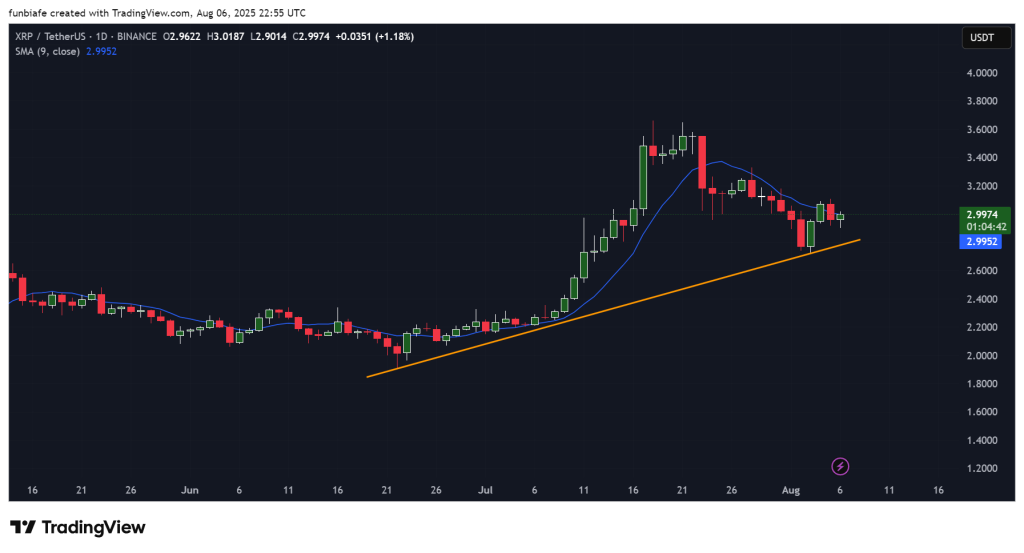
The candles are small and indecisive, not exactly what you want to see if you’re hoping for a breakout. Bulls need to push past $3.05 to regain momentum. If they don’t, a drop below $2.85 could flip the script and send XRP lower.
📈 Technical Indicators (Daily)
| Indicator | Value | Signal |
| MACD (12,26) | 0.076 | Slight bullish crossover, early momentum |
| ADX (14) | 27.859 | Moderate trend, still leaning bearish |
| CCI (14) | -77.91 | Bearish bias, but not extreme |
| RSI (14) | 51.09 | Totally neutral – market’s undecided |
| ROC | -5.828 | Negative momentum, sellers have the edge |
| Bull/Bear Power (13) | -0.1643 | Bears slightly stronger right now |
Summary: Only MACD is flashing green. The rest show that sellers still have control, or at least that buyers haven’t taken over yet.
🔮 What Could Happen Next
Bullish Scenario:
A strong move above $3.10 might open the door to $3.25 or even $3.50, but it’ll need some real momentum.
Neutral Scenario:
XRP price holding between $2.85 and $3.00 means more sideways chop. No trend shifts unless something big happens.
Bearish Scenario:
A close below $2.85 could trigger a slide to $2.60 or even $2.30, levels we last saw in early July.
🧠 Final Thoughts
XRP price is sitting at a crossroads. It’s holding up just fine above trendline support, but buyers still haven’t shown the strength needed to break past resistance.
The $3.05 zone is key. Break it, and bulls might get some momentum back. Lose $2.85, and sellers could take charge. For now, XRP is drifting sideways, and everyone’s watching for the next big move.
Read Also: Top Analyst Says Ripple (XRP) Will Be Worth More than Bitcoin: Here’s What He Sees
Subscribe to our YouTube channel for daily crypto updates, market insights, and expert analysis.