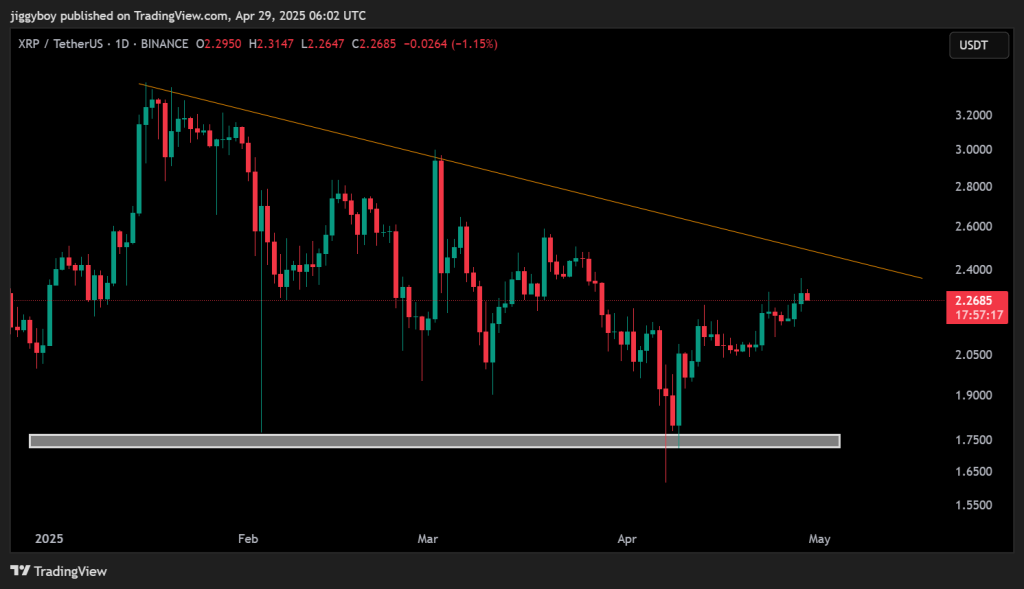
The XRP price saw a slight dip yesterday, slipping from a local high of $2.31 down to around $2.27 by the daily close. As predicted, XRP faced strong resistance at the $2.30 mark. We mentioned in our previous article that a clear breakout above $2.30 could open the path to $2.35 or even $2.50, but that move did not materialize.
Let’s take a look at where XRP could be headed today.
What you'll learn 👉
XRP Chart Analysis
XRP is trading at $2.28 at writing. The daily chart shows that the price continues to hover just below the descending trendline that has acted as resistance since February. Despite a bullish run through most of April, the XRP price has yet to confirm a breakout above this key level.
The latest price action indicates hesitation near $2.30, where sellers have once again stepped in. This level coincides with the upper boundary of the descending trendline, which has rejected several upward attempts in recent months. The structure still maintains higher lows, showing underlying buying interest. However, unless the price decisively closes above $2.30–$2.35, upside potential remains limited.
On the downside, XRP price has nearby support at $2.10, with stronger demand expected in the $1.95–$2.00 zone. A breakdown below these levels could trigger a deeper retest of the $1.70–$1.80 support region, which has held multiple times this year.
Technical Indicators
The indicators are currently showing mixed signals. The MACD is slightly positive at 0.007, which suggests weak but present bullish momentum. However, other momentum indicators lean bearish.
| Indicator | Value | Signal Interpretation |
| MACD | 0.007 | Slight bullish momentum |
| CCI (14) | -130.7 | Oversold, trend weakening |
| Ultimate Oscillator | 44.06 | Weak buying pressure |
| ROC (Rate of Change) | -0.303 | Momentum declining |
| Bull/Bear Power (13) | -0.0337 | Slight bearish dominance |
The Commodity Channel Index (CCI) sits at -130.7, showing oversold conditions and a weakening trend. The Ultimate Oscillator is at 44.06, slightly below neutral, indicating that buying strength is fading. The Rate of Change (ROC) sits at -0.303, confirming that momentum is cooling. Meanwhile, the Bull/Bear Power indicator is -0.0337, hinting at mild bearish pressure.
Read Also: Too Late to Buy BONK? Price Eyes New Highs After Perfect Bounce
XRP Price Forecasts for Today
For April 29, XRP may once again follow one of two key paths depending on how it reacts to the $2.30 resistance zone:
For the bullish scenario, if XRP breaks above $2.30 with higher volume and stays there, it could push toward $2.35. If this momentum continues, prices might climb further into the $2.50-$2.60 range. This scenario would need support from rising MACD values and a pickup in volume.
For the bearish scenario, if XRP can’t break above the trendline and falls below $2.20, we’ll likely see a pullback to $2.05-$2.10. If sellers take control, prices could drop to $1.95 or even test the broader demand zone between $1.70 and $1.80.
Given current hesitation near resistance and mixed technicals, XRP price might stay range-bound between $2.20 and $2.30 while traders wait for a clear breakout or breakdown signal.
Subscribe to our YouTube channel for daily crypto updates, market insights, and expert analysis.

We recommend eToro
Wide range of assets: cryptocurrencies alongside other investment products such as stocks and ETFs.
Copy trading: allows users to copy the trades of leading traders, for free.
User-friendly: eToro’s web-based platform and mobile app are user-friendly and easy to navigate.