The XRP price stayed mostly stable yesterday, hovering around the $2.16-$2.17 zone without any major breakout or breakdown. We predicted yesterday that if XRP cleared $2.22 resistance, it could push toward $2.30-$2.35, but that breakout did not occur.
Let’s take a look at where the XRP price could be heading today.
What you'll learn 👉
XRP Chart Analysis
XRP is now trading at $2.1697 as of April 27. Looking at the 4H chart, the price continues to move sideways in a tight consolidation pattern. The rising trendline that has formed since mid-April is still intact and acting as dynamic support, with stronger horizontal support found between $2.00 and $2.05.
The recent price action shows XRP forming higher lows, creating a slow compression between rising support and horizontal resistance at $2.20-$2.22. This setup resembles an ascending triangle, which often precedes a bullish breakout if volume increases.
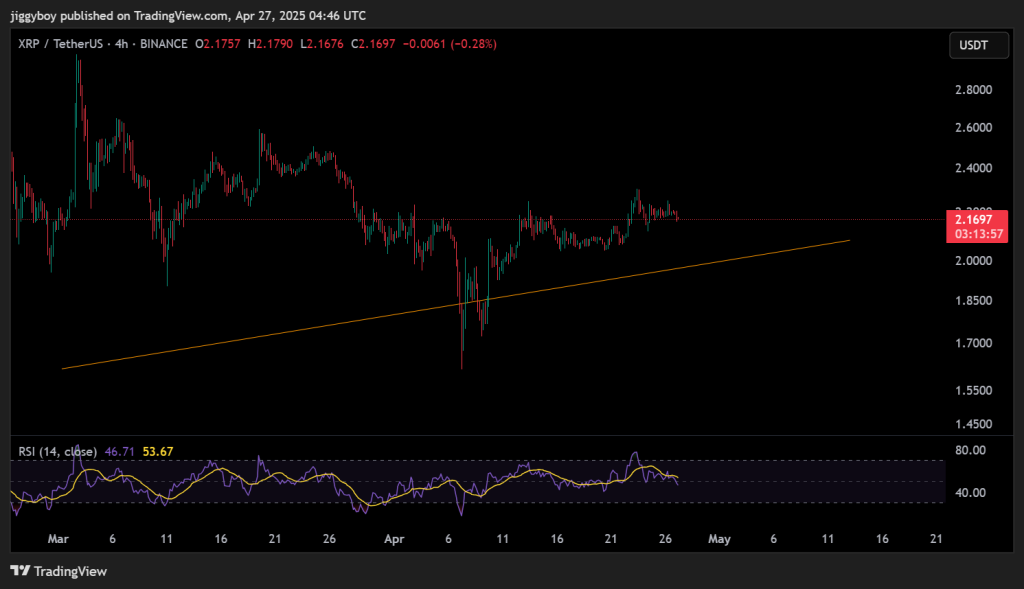
Support for XRP is visible at $2.10, with a stronger base at the $2.00-$2.05 zone. If selling pressure intensifies, major support from earlier this month sits at $1.80-$1.85. On the resistance side, the XRP price faces immediate hurdles at $2.22. If that level is broken, the path toward $2.30 and $2.35 could open.
Volume appears to be declining slightly based on the price movement, which often suggests a larger move is brewing.
Technical Indicators
Technical indicators paint a cautious picture for XRP. The RSI is at 46.71, showing a neutral but slightly bearish market stance. This leaves room for both upward and downward moves.
The MACD reads -0.005, signaling mild bearish momentum without strong downside pressure yet. The Commodity Channel Index (CCI) stands at -135.4883, suggesting strong selling pressure and mild oversold conditions that could potentially lead to a short-term bounce.
| Indicator | Value | Signal Interpretation |
| MACD | -0.005 | Mild bearish crossover zone |
| CCI (Commodity Channel Index) | -135.4883 | Strong selling pressure, oversold conditions |
| Ultimate Oscillator | 37.669 | Bearish momentum present |
| ROC (Rate of Change) | -0.968 | Weak momentum, slight downward pressure |
| Bull/Bear Power | -0.0192 | Slight bearish dominance |
The Ultimate Oscillator sits at 37.669, reinforcing a bearish tilt among traders. The Rate of Change (ROC) is negative at -0.968, showing a slight price decline, and Bull/Bear Power sits at -0.0192, favoring sellers, though not strongly.
XRP Price Forecasts for Today
For April 27, XRP could once again follow two possible paths based on the current technical setup:
In the bullish scenario, if XRP price manages to break through the $2.22 resistance with increasing volume, it could target $2.30 first as an initial resistance zone. With continued buying momentum and broader market support, XRP could revisit the $2.35 level. Under ideal conditions, and if Bitcoin remains stable, a push toward $2.50 could come into view.
In the bearish scenario, if XRP loses the $2.15 support level, the price could fall toward the $2.05 zone. A further breakdown might bring XRP to test the $2.00 area or even the major support level at $1.85 if broader market weakness persists.
Given the ongoing weekend environment with typically lower trading activity, XRP price may continue trading between $2.15 and $2.20 unless a catalyst emerges to trigger a breakout in either direction.
Read Also: Stellar (XLM) Price Breakout Confirmed: Here’s the Next Big Target
Subscribe to our YouTube channel for daily crypto updates, market insights, and expert analysis.

We recommend eToro
Wide range of assets: cryptocurrencies alongside other investment products such as stocks and ETFs.
Copy trading: allows users to copy the trades of leading traders, for free.
User-friendly: eToro’s web-based platform and mobile app are user-friendly and easy to navigate.