The XRP price remained mostly calm for the past few days, trading between $2.05 and $2.15. It does look like neither bulls nor bears are ready to take control as the broader crypto market is also calm this week.
Let’s determine where the XRP price could be headed today.
What you'll learn 👉
XRP Chart Analysis
XRP is trading at $2.09 right now. The 200-day moving average sits around $1.91, and XRP’s price is above this line, which is a good sign for buyers. This moving average is slightly trending upward, suggesting growing support at these levels.
When we talk about the recent price movements, XRP formed a rounded bottom after dropping through March and early April. The price bounced back from the $1.91-$1.93 support area, which sits right above the 200-day moving average. When prices pushed higher, they hit resistance at $2.15, and now we’re seeing some sideways movement.
Strong support exists at $1.91-$1.93 near the 200-day average. Another important support level is the $2.00 mark, which is both a psychological level and a short-term horizontal support line. If these don’t hold, the next major support sits at $1.85.
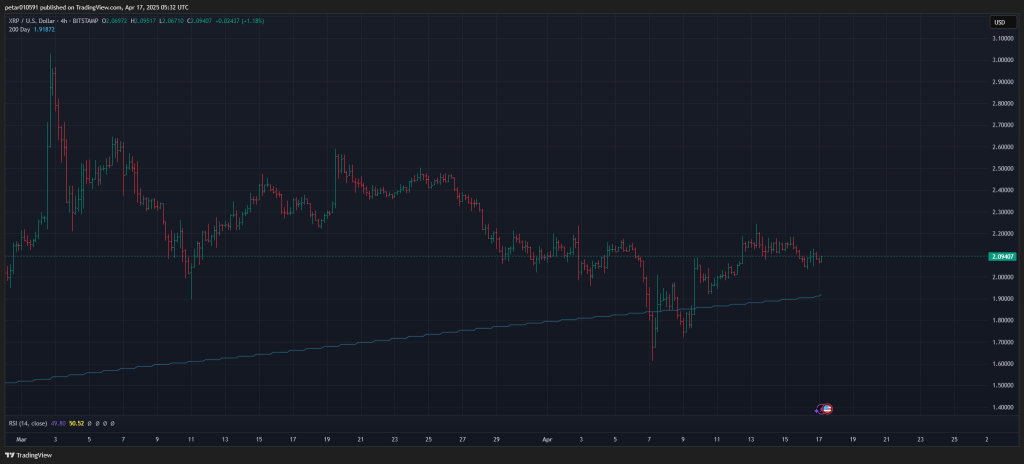
For resistance, XRP faces a short-term barrier at $2.15. A break above this could open the path to $2.25, and potentially $2.40 after that.
Technical Indicators
The RSI reading is currently 50.49, which is perfectly neutral. This means the market isn’t showing overbought or oversold conditions, and the price movement can go in either direction.
On the daily timeframe, the MACD sits at -0.042, showing slight bearish momentum, but it’s flattening out. This could signal a potential reversal or continued sideways trading. The CCI reads 36.26, which is mildly bullish since it’s above zero but still below 100, indicating weak buying pressure building up.
The Rate of Change (ROC) is positive at 1.385, showing modest upward momentum. Meanwhile, the Bull/Bear Power indicator sits at -0.0114, almost flat, indicating neither buyers nor sellers have a clear advantage right now.
Read also: What Could XRP Be Worth if Ripple Captures 10% of SWIFT and Hidden Road’s Volume?
XRP Price Prediction for Today
If XRP breaks above $2.15 with good trading volume, we could see momentum build quickly. The first target would be $2.25, followed by $2.38 if buying pressure continues. Traders should watch for a bullish MACD crossover on the 4-hour chart, RSI climbing above 60, and higher volume to confirm this bullish move.
On the other hand, if XRP drops below $2.00 and closes under this level, we might see a decline toward $1.93 near the 200-day moving average. If this doesn’t hold, the price could fall to $1.85 where horizontal support exists. Signs of this bearish scenario would include the MACD moving deeper into negative territory, RSI dropping below 45, and a break below the 200-day moving average support.
The market currently appears balanced, with neither bulls nor bears showing clear dominance. Traders should watch these key levels and indicators for signals of the next significant price movement.
Subscribe to our YouTube channel for daily crypto updates, market insights, and expert analysis.

We recommend eToro
Wide range of assets: cryptocurrencies alongside other investment products such as stocks and ETFs.
Copy trading: allows users to copy the trades of leading traders, for free.
User-friendly: eToro’s web-based platform and mobile app are user-friendly and easy to navigate.