
Ripple’s XRP price is beginning the week with defensive action at near $2.78, with minimal vigor after its inability to reclaim the $3 handle.
The token has been ranging following its initial September advance, and traders now await whether the next move will be a breakout or another challenge at support.
What you'll learn 👉
What the XRP Chart Is Showing
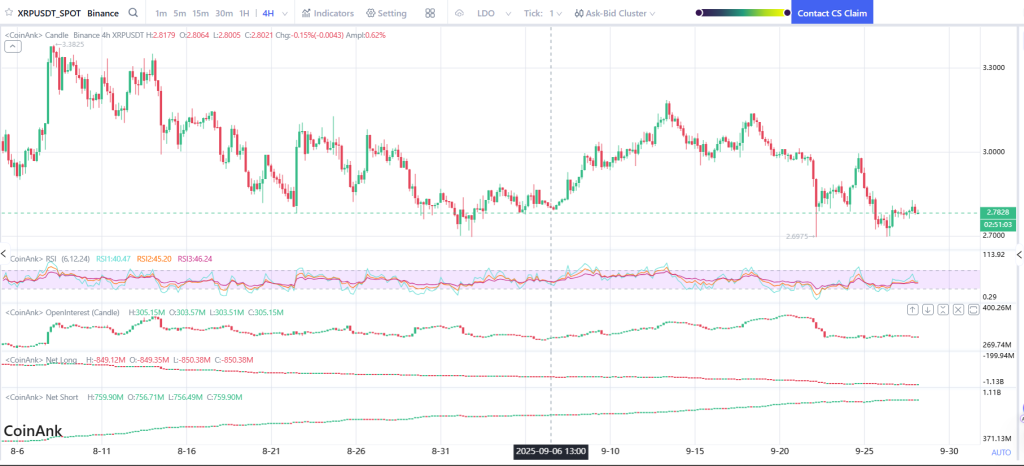
The 4H chart highlights a tightening range between $2.70 support and $3.00 resistance. Price briefly dipped to $2.69 on September 20 but recovered in a little while, although bulls could not manage above $3.
XRP price has since then been charting lower highs and higher lows, which reflects indecision. The sideways trend is a sign of consolidation, a phase that tends to lead to a steeper move.
Market Indicators
Momentum remains neutral. The RSI is trapped between 40 and 46, below the midline of 50, reflecting a weak bearish inclination but no aggressive trend.
Open interest stands at roughly $305 million, showing flat activity among leveraged traders.
Meanwhile, net longs sit near –$850 million and net shorts around +$760 million, suggesting balance in positioning with no side firmly in control.
Read Also: World Liberty Financial Kicks Off Buyback and Burn: Where Is WLFI Price Headed Next?
XRP Price Short-Term Outlook for the Week
The token remains above the $2.70–$2.75 region. Holding this level for the bulls should allow XRP to test the $2.95–$3.00 resistance. A clean breakout above $3 should take XRP to $3.10–$3.20, as long as the market mood becomes bullish.
Conversely, a drop below $2.70 should take XRP price down to the $2.50–$2.55 area, which is where an important liquidity pocket lies.
In brief, XRP is on the verge of consolidation next week. Provided the support at $2.70 holds, the bias is moderately bullish, with sellers expecting a volume-backed break above $3 to consolidate the next leg higher.
Subscribe to our YouTube channel for daily crypto updates, market insights, and expert analysis.