XRP price continues to sit at the center of one of the most debated chart structures in the market. Price action has remained tightly connected to long term geometry rather than short term momentum, which explains why projections for Ripple price look unusually wide this cycle. The discussion has shifted away from daily noise and toward larger structural levels that have shaped XRP price behavior for years.
That broader perspective appears clearly in analysis shared by EGRAG CRYPTO, whose focus remains on the monthly chart rather than short lived intraday moves. His work frames XRP price within a multi channel structure that behaves like a logarithmic regression, a method that emphasizes probability zones rather than exact targets.
What you'll learn 👉
XRP Price Structure Shows Repeating Geometry Across Market Cycles
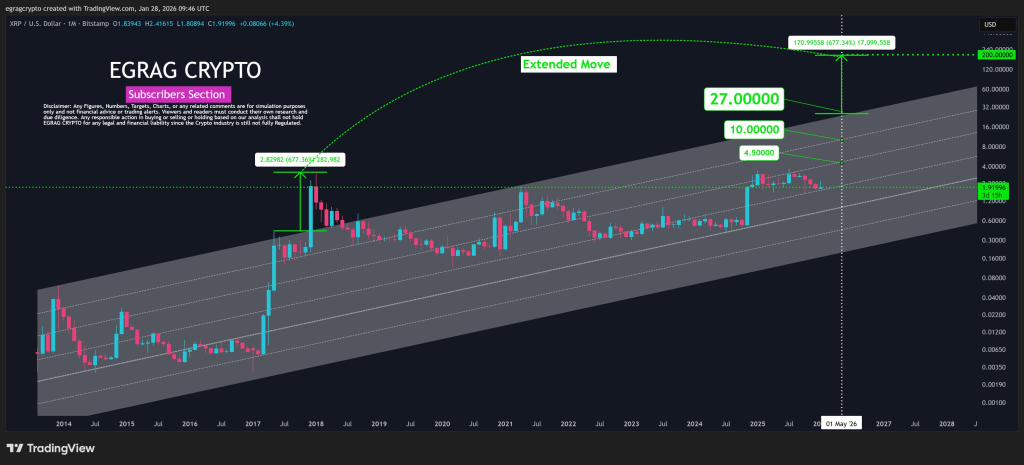
XRP price has historically respected diagonal support and resistance channels that stretch across multiple market cycles. According to EGRAG CRYPTO, the same structural behavior that guided Ripple price during 2017 is visible again in the current cycle. Price reached the upper boundary of that channel during the previous bull market before extending significantly beyond it.
That earlier extension measured roughly 677% beyond the upper channel. When that historical behavior is mapped onto current geometry, it creates a wide range of potential outcomes rather than a single destination. Ripple price is not reacting randomly within this framework. Movement continues to align with the same channel symmetry seen before.
Ripple Price Best Case Scenarios Based On Upper Channel Extensions
The first high conviction scenario focuses on XRP price reaching the upper channel without requiring extreme market conditions. EGRAG CRYPTO identifies the $4.5 region as the initial structural test, with probability estimates between 80% and 90%. That level represents a clean interaction with the channel rather than an aggressive extension.
A more expansion-driven scenario places Ripple price closer to $10 if momentum builds beyond the first boundary. Probability estimates drop to the 60% to 75% range, reflecting the need for stronger market participation. The cycle peak scenario becomes more selective, projecting XRP price near $27 if historical extension zones repeat. That outcome carries lower probability around 50% to 55%, but remains grounded in past behavior.
XRP Price Worst Case Scenario Still Respects Long Term Structure
The most extreme projection discussed by EGRAG CRYPTO involves a black swan style extension toward $200. That outcome relies on a full macro fractal similar to 2017 and carries probability estimates between 20% and 35%. The lower likelihood does not invalidate the scenario. It simply reflects how rarely markets reach the far edges of historical geometry.
Importantly, even the worst case for XRP price within this framework does not imply structural failure. Price remaining inside the broader channel still preserves the long term pattern that has guided Ripple price for over a decade.
Read Also: Institutions Are Not Watching Anymore: They’re Loading Bittensor (TAO) and Two Other Cryptos
The key takeaway from this XRP price prediction lies in the method rather than the numbers. Channels do not predict exact outcomes. Channels guide probability and context. Ripple price continues to move within a structure shaped by symmetry and time, not by short term sentiment.
Subscribe to our YouTube channel for daily crypto updates, market insights, and expert analysis.