
XRP price has finally reached the $1.10 support area that technical analyst CasiTrades has been tracking for weeks, but she is not calling a bottom yet.
The move comes during another ugly stretch for crypto. Bitcoin briefly fell below $74,000, Ethereum dropped under $2,125, and XRP was pushed toward $1.10 as more than $1 billion in leveraged positions were liquidated across the market.
XRP has since bounced slightly above $1.10, but CasiTrades believes sellers may still have another move left.
Her reason is simple: price reached support, but momentum has not confirmed that selling pressure is finished.
What you'll learn 👉
Why $1.10 Was Such an Important XRP Target
CasiTrades’ 4-hour chart shows an unusually strong Fibonacci confluence around the current area.
The local 0.854 retracement sits near $1.0999.
Almost directly underneath it, the larger macro 0.786 Fibonacci level sits around $1.0912.
That overlap is why she had been waiting for the $1.10 region rather than treating it as a random psychological level.
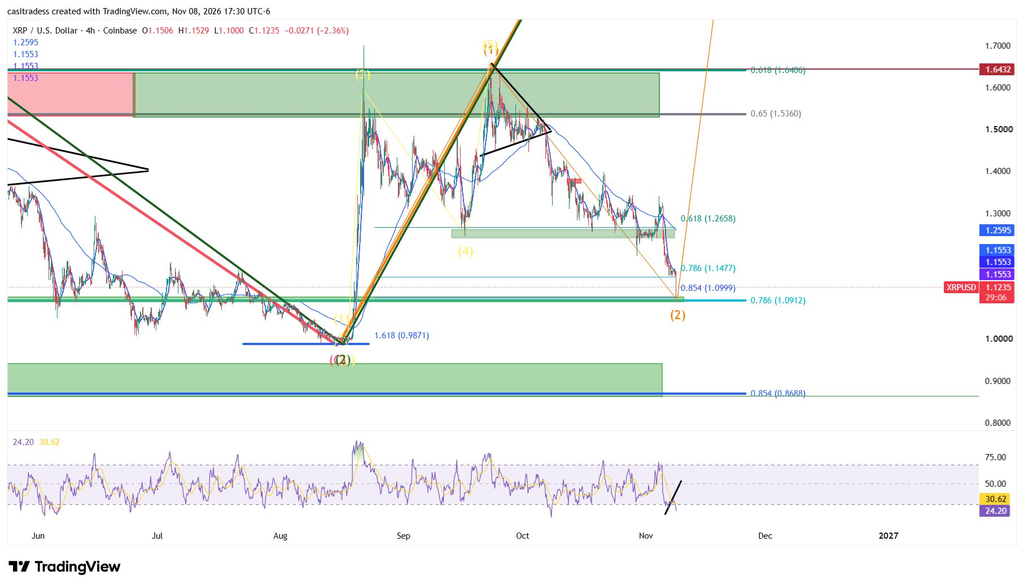
XRP touched the zone almost exactly during the latest selloff.
From a technical perspective, that part of the prediction worked.
The problem is what happened to momentum on the way there.
Read also: XRP Analyst Says the Next Bear Market Bottom Could Be 3X Higher Than Today’s XRP Price
RSI Says XRP Sellers May Not Be Finished
The RSI reading on CasiTrades’ chart is around 24.
That is deeply oversold, but oversold does not automatically mean a reversal is ready.
In strong downtrends, RSI can remain depressed as price keeps making new lows.
CasiTrades specifically wants to see buyers step in and create a clearer momentum reversal, ideally with bullish divergence.
That would mean XRP makes another test or even a slightly lower low near support, but RSI refuses to make a corresponding new low.
Such a setup would show that price is still falling while selling momentum is weakening.
Right now, she does not believe that confirmation is strong enough.
$1.00 and $0.90 Are Now the Danger Levels
If $1.10 cannot hold, the chart quickly becomes more uncomfortable for XRP bulls.
The next obvious level is the psychological $1 mark.
CasiTrades’ broader structure also shows a deeper support zone around $0.87-$0.90.
Her chart places the 0.854 macro Fibonacci retracement at approximately $0.8688, lining up closely with the $0.90 region she has repeatedly discussed.
From $1.10, a drop to $0.90 would mean another decline of roughly 18%.
That does not make $0.90 the base case.
It does show why defending $1.10 matters so much.
XRP Price Forecast: There Is Still a Bullish Scenario
The chart is not purely bearish.
CasiTrades still labels the current decline as a potential Wave 2 correction inside a larger bullish structure.
If $1.10 holds and XRP begins recovering, her Elliott Wave roadmap leaves room for a much stronger Wave 3 move later.
But price needs to prove the support works first.
A recovery through roughly $1.15-$1.16 would be a small first step.
The much more important level sits near $1.26-$1.27, where previous support broke down during the crash.
Until XRP can recover those areas, the immediate structure remains weak.
For now, CasiTrades got the $1.10 target she had been waiting for.
What happens next is more important.
If buyers finally appear and momentum starts diverging from price, this zone could become the bottom of the correction.
If selling remains as strong as the RSI currently indicates, XRP may still have one more painful move toward $1 or even $0.90 before the market finds its floor.
Subscribe to our YouTube channel for daily crypto updates, market insights, and expert analysis.