A familiar pattern is starting to show up around XRP, and it is getting harder to ignore. The mix of growing fear around Ripple price sentiment and the token sitting right on its long-tested support has started to look like the setup that came before earlier rebounds. This combination raises the question many holders are already thinking about: could XRP be approaching another double-digit move from here?
Santiment’s sentiment data shows that XRP has slipped into another sharp wave of negative crowd expectations. Their visual breakdown highlights two repeating scenarios. Periods when discussions turn slightly more optimistic than usual tend to show up near short-term tops. Moments when negative commentary becomes unusually heavy often appear near local bottoms.
😨 XRP (-31% in the past 2 months), unlike Bitcoin, is seeing the most fear, uncertainty, & doubt (FUD) since October, according to our social data.
— Santiment (@santimentfeed) December 4, 2025
🔴 Circles indicate days where there are abnormally higher BULLISH comments compared to BEARISH comments, about XRP (Greed Zone)… https://t.co/lJNW8zlRwK pic.twitter.com/ZoFmwrtw3h
The latest fear spike looks nearly identical to the one seen on November 21. At that time, sentiment was extremely bearish, and many expected more downside after weeks of steady decline. Just a few days later, XRP surprised the market with a rebound of about 22%. That rally slowed only when sentiment shifted back toward optimism.
Current readings show the sentiment ratio returning to the same fear zone seen before the November bounce. The cluster of negative reactions forming around the present date suggests another moment of excessive bearishness from the crowd. Historically, these conditions have often marked turning points for XRP rather than the start of deeper selloffs.
XRP Price Chart Repeats The Familiar Support Bounce Zone
Ripple’s weekly chart continues to respect its long-running support area between $1.7 and $1.8. This level has acted as a reliable floor since December 2024. Each time price returned to this band, XRP managed to recover, with several of those reversals turning into meaningful rallies.
The chart shows long wicks and tight clusters of candles around the support zone, a sign that sellers are losing force while buyers quietly absorb supply. A strong example came earlier in the year when XRP dipped into the zone, held it, and then pushed into a multi-week upward move.
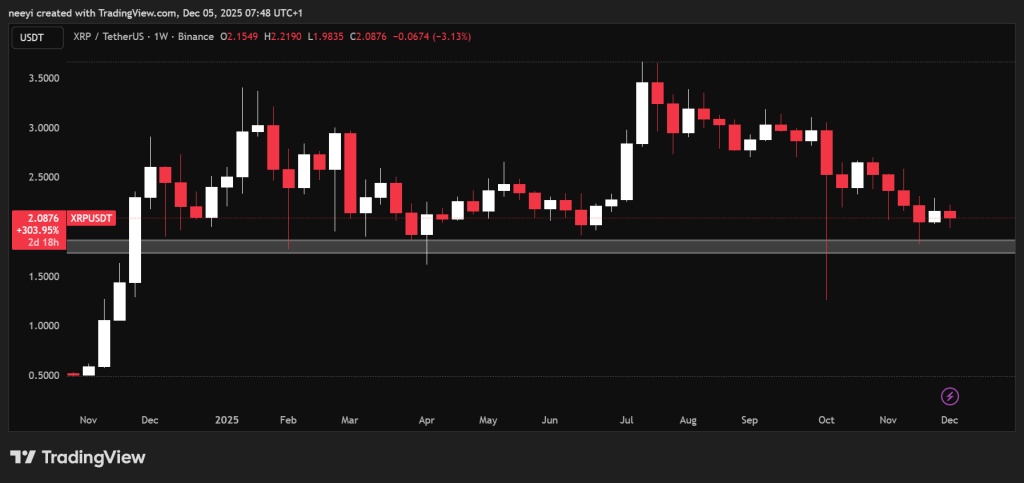
Now, XRP has once again settled inside that same region. The latest weekly candle shows price stabilizing near $2. Buyers have defended this zone repeatedly over the past year. The token also remains well above the temporary capitulation wick from early October, which turned out to be panic rather than a structural breakdown.
Why Another Bounce Remains Possible For Ripple Price
Two signals are intersecting at the same time: sentiment and structure. The Santiment chart shows another spike in fear, a condition that previously aligned with market bottoms rather than tops. At the same time, the price chart places XRP directly on its proven support band, where earlier rebounds consistently formed.
Read Also: Hedera Reaches 9M Users as RWA Tokenization Surges – What Happens to HBAR Price Next?
Historically, strong fear has been a more reliable reversal indicator for XRP than strong optimism. When the crowd expects the worst, the market often begins to move in the opposite direction. The current setup mirrors that pattern closely. XRP is sitting in the same environment that triggered the recent late-November rebound, with the same emotional profile appearing across the sentiment data.
A rally is never guaranteed, but the similarities between now and earlier inflection points are becoming more visible.
Subscribe to our YouTube channel for daily crypto updates, market insights, and expert analysis.