The price of XRP might be heading into a key moment, with its price action and market sentiment showing two very different stories. Top analyst Steph Is Crypto shared a chart on X (formerly Twitter) that shines a light on what could come next for the token. In the tweet, he pointed out, “The #XRP funding rates are extremely low. The bottom is in sight.” That’s got people wondering—are we about to see a bounce, or is there more downside ahead?
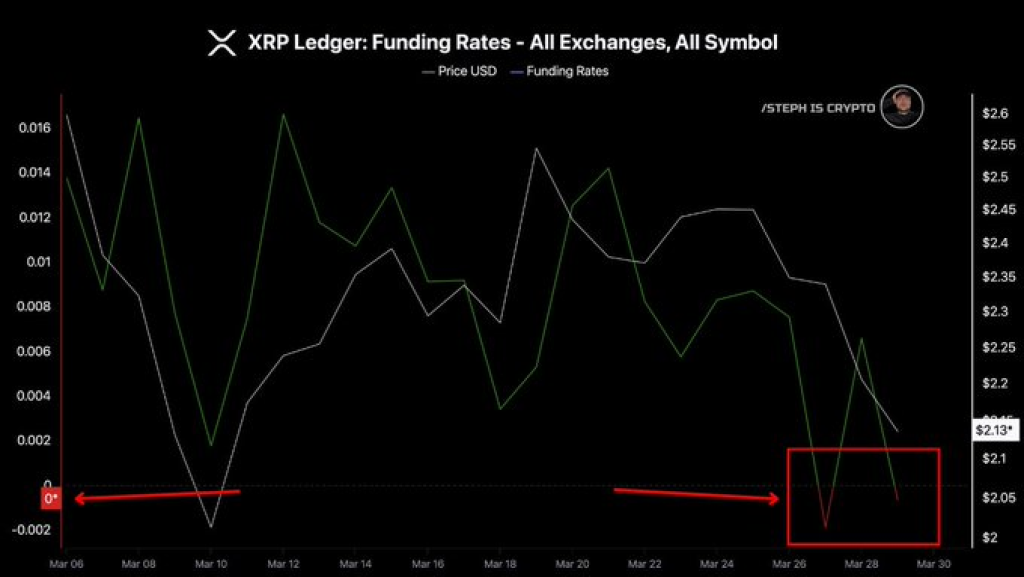
Looking at the data from March 6 to March 30, XRP price dropped from around $2.55 to $2.13. There were a few short-lived recoveries along the way, around March 12, March 18, and March 24, but each time, sellers came back strong. These quick rallies that didn’t last long may have trapped some late buyers expecting a reversal.
The biggest drops happened between March 6 and 9 and again from March 26 to 30, when the price fell below $2.15. But in the last few days of March, XRP seemed to find a bit of stability. It hovered in the $2.00 to $2.05 range, where buyers showed up and stopped it from sliding further. Even though market sentiment looked shaky, the price of XRP managed to stay above $2.00, hinting that this zone could be acting as short-term support.
What you'll learn 👉
XRP Funding Rates Indicate a Shift in Sentiment
The funding rate data from all exchanges, shown by a green line on the chart, reflects sentiment among futures traders. Positive rates generally indicate bullish bias, while negative rates point to short-heavy positioning. Between March 6 and 10, funding rates turned negative, signaling growing pessimism among market participants.
Although rates briefly turned positive mid-month, they dropped again to near-zero or negative levels from March 26 to 30. Historically, low funding rates, especially when accompanied by a price plateau, can precede price recoveries. This was observed earlier in March, where negative rates were followed by a short-lived bounce.
XRP Technical Patterns Suggest Accumulation
A red box highlighted on the chart by Steph Is Crypto emphasizes the March 26–30 range, where funding rates remained low while price movement flattened. The combination of a stable XRP price and negative funding rates may indicate that sellers are losing momentum. This setup often suggests accumulation, where traders with longer-term positions begin entering the market.
Earlier in the month, a similar structure developed when funding rates turned negative, and a bounce followed shortly after. The current pattern mirrors that earlier phase, raising attention among market analysts who monitor behavioral trends in derivatives markets.
Read Also: Pi Coin Price Prediction for Today (March 30)
Analyst Cautions on Bearish Divergence
Between March 16 and 18, price action formed a slightly higher high while funding rates decreased. This mismatch is typically referred to as bearish divergence. It suggests weakening upward momentum, which was later confirmed by the decline starting on March 19. Observers note that the current pattern does not repeat that divergence but instead presents a lower volatility zone, possibly setting the stage for a short-term reversal.
While the funding rates and support levels provide context, traders are watching for confirmation before acting. No definitive breakout has occurred yet, and further XRP price consolidation within the $2.00–$2.10 zone remains a possibility.
Subscribe to our YouTube channel for daily crypto updates, market insights, and expert analysis.

We recommend eToro
Wide range of assets: cryptocurrencies alongside other investment products such as stocks and ETFs.
Copy trading: allows users to copy the trades of leading traders, for free.
User-friendly: eToro’s web-based platform and mobile app are user-friendly and easy to navigate.