XRP opened the new week with sideways price action, and the broader structure still shows no clear breakout. The market tried to move higher over the weekend, but the move lacked confirmation. At the same time, XRP ETF headlines continue circulating, yet price remains inside the same corrective structure. That leaves traders waiting for a cleaner signal.
The chart shared by CasiTrades highlights exactly where that signal sits. The key level is still $2.41 on Coinbase. That zone acted as a strong fib support in previous reactions, and the current rally is now approaching it from above. The market continues to respect the macro structure, so the next move depends on how price behaves during the backtest.
What the XRP Chart Is Showing Now
The chart makes the structure very clear. The XRP price rallied into a rejection zone near the $2.58 region. A sharp downward arrow on the chart signals the expected drop back toward the support line. The main orange trend structure still points toward a corrective pattern, and the diagonal break has not produced a clean follow-through.
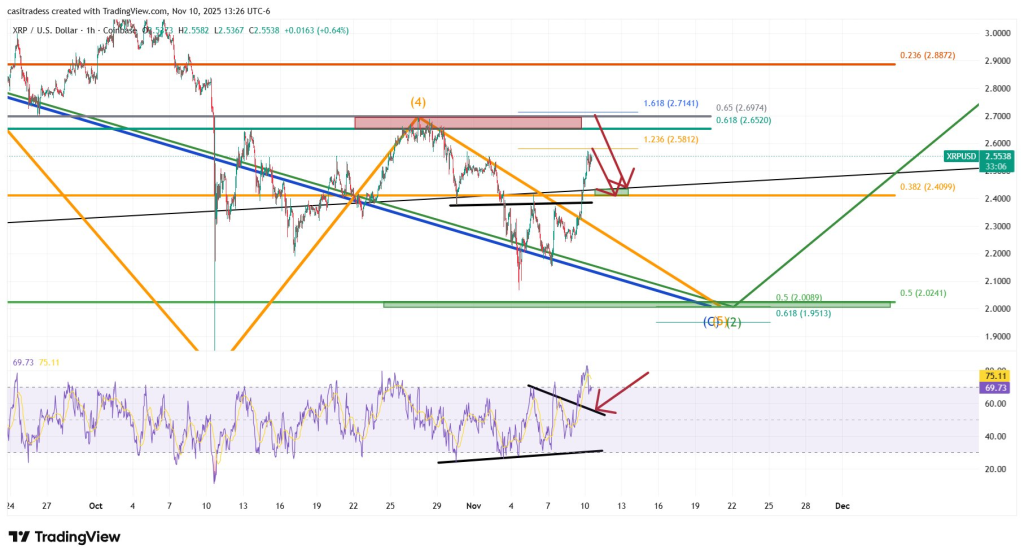
A lower black support band intersects almost perfectly with the $2.41 level. That convergence makes it the most important decision zone on the chart. A bounce there could form a higher low and reopen the path toward $2.58 and potentially $2.71. A weak reaction, however, increases the probability of continuation toward the macro 0.5 fib near $2.00.
The RSI panel also supports this idea. The indicator shows a bearish divergence. Price formed a higher high, while RSI formed a lower high. The red arrow marks the likely rejection point. Divergence during a rally usually warns of a pullback, and that aligns with the expectation for a backtest.
Read also: Best Crypto to Buy Now Ahead of the XRP ETF Launch
XRP’s Market Structure and the Next Probability Zone
The macro fib map still shows the $2.00 region as a valid target if $2.41 fails. CasiTrades noted that subwave measurements support one more corrective leg lower. Bitcoin adds weight to this idea. BTC has not broken above $107,000 on a four-hour close. It still needs a final test of $97,000 or even $94,000. That keeps downward pressure on altcoins, including XRP.
The setup now sits in a zone of tension instead of confirmation. If the XRP price holds $2.41, the market regains short-term momentum. If it loses that level, the correction likely completes with a test near $2.00.
The next reaction at support will reveal the direction of the next major move.
Subscribe to our YouTube channel for daily crypto updates, market insights, and expert analysis.