
XRP’s price moves have caught traders’ eyes, with two experts seeing different paths ahead. One chart points to a possible upswing, while the other shows a drop coming. These takes from traders Matthew Dixon and Ali offer different views on where XRP might go next.
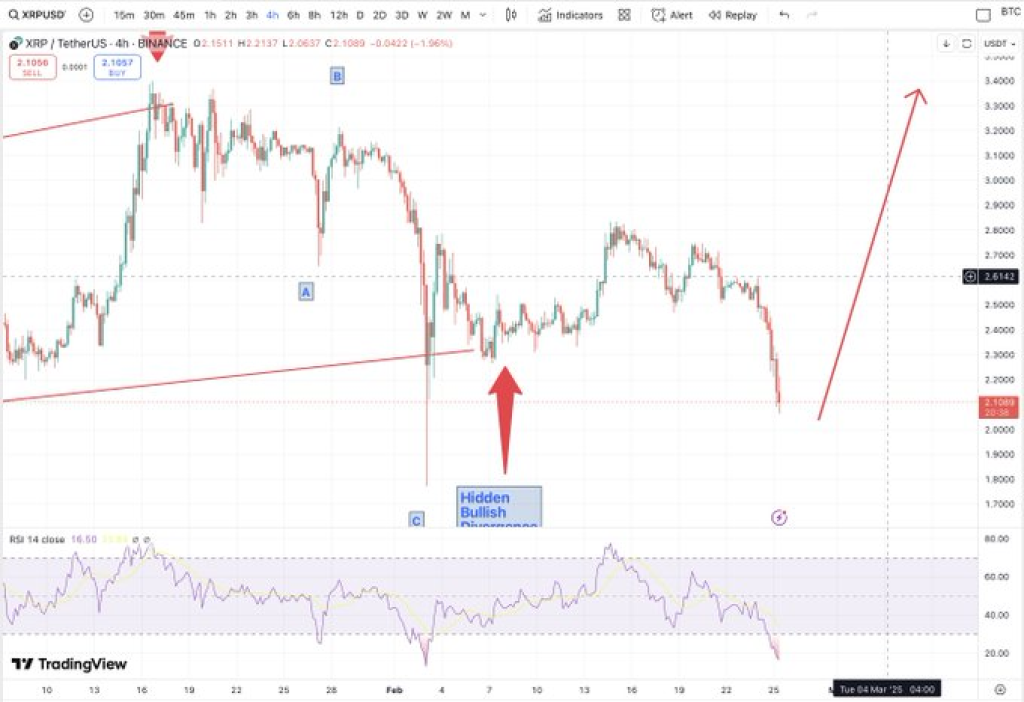
Veteran analyst Matthew Dixon sees a potentially good sign for XRP, noting what he calls a hidden bullish pattern. His 4-hour chart tracks XRP’s fall from above $3.00 down to about $2.10, where it’s now finding some stability. The RSI shows the asset as oversold, something that often happens before prices bounce back.
Moreover, Dixon describes the market conditions as a “gift,” implying a strong buy opportunity. His chart features an upward projection, suggesting a potential return to previous resistance levels at $2.50 and possibly $3.00 if buying pressure strengthens.
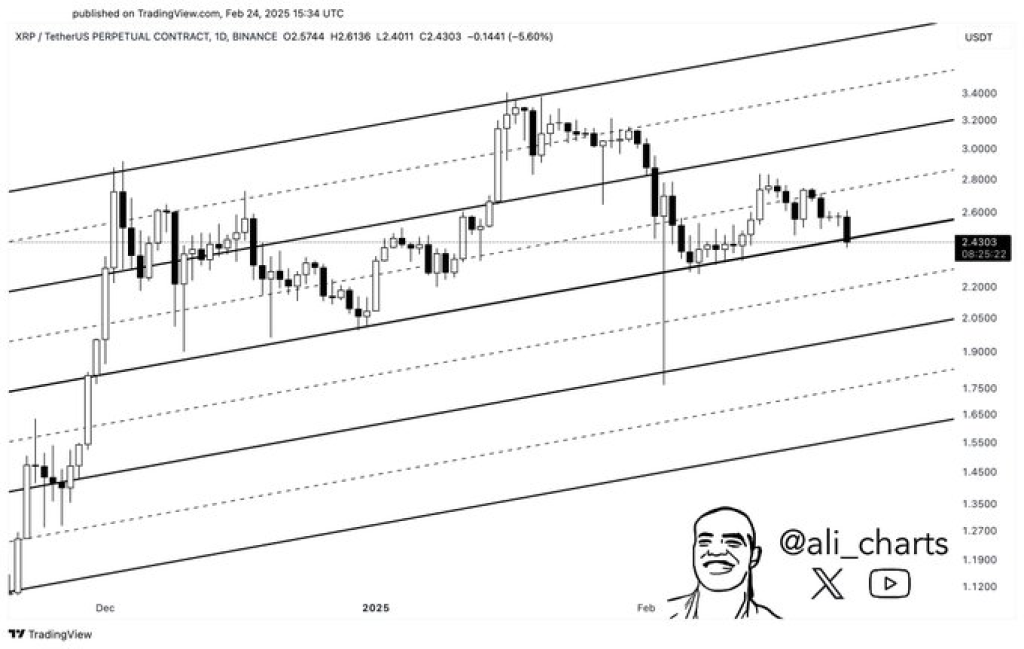
On the other hand, Ali’s analysis on a daily timeframe suggests the opposite. He notes that the price of XRP is breaking below an ascending parallel channel, signaling a bearish trend. His chart identifies key support at $2.40, with a potential move toward $1.65 if the breakdown continues. His tweet reinforces this outlook, stating that XRP is “breaking out of an ascending parallel channel, targeting $1.65.”
What you'll learn 👉
XRP Technical Patterns and Key Support Levels
The price structure in Dixon’s chart emphasizes a long-term ascending trendline, which has provided multiple support bounces. The RSI indicator shows divergence, where the price makes lower lows while the RSI moves higher—a common signal of potential trend reversals. If XRP’s price reclaims $2.20-$2.30, a move toward $2.50-$3.00 could follow.
Conversely, Ali’s analysis suggests XRP has lost key support at $2.40. His chart outlines a potential breakdown scenario where the price could test $2.20 and, if that level fails, decline toward $1.65. This aligns with a measured move projection, suggesting a bearish continuation if XRP does not reclaim lost levels quickly.
Read Also: Toncoin Price Action Hints at Recovery—Is Now the Best Time To Buy TON?
Market Sentiment and XRP Potential Price Scenarios
Dixon’s bullish outlook contrasts with Ali’s bearish perspective, highlighting uncertainty in the market. Traders monitoring XRP will likely look for confirmation signals—a sustained move above $2.50 could support Dixon’s bullish case, while failure to hold $2.20 might validate Ali’s bearish target.
With both analyses presenting different scenarios, traders remain focused on XRP’s price next movements. Whether the asset rebounds toward resistance or continues its decline, upcoming price action will determine which projection holds.
Subscribe to our YouTube channel for daily crypto updates, market insights, and expert analysis.

We recommend eToro
Wide range of assets: cryptocurrencies alongside other investment products such as stocks and ETFs.
Copy trading: allows users to copy the trades of leading traders, for free.
User-friendly: eToro’s web-based platform and mobile app are user-friendly and easy to navigate.


