XRP is starting to show one of the strongest long-term bullish signals it has printed in years, and analysts say the market may be preparing for a much bigger move.
A fresh look at the three-month Ichimoku Cloud shows a setup that even past bull cycles failed to achieve, and that alone has traders talking about higher targets again.
What you'll learn 👉
XRP Holds Above Key Ichimoku Levels for the First Time Ever
Market analyst Matt Hughes was the first to point out what’s happening. On the three-month chart, the XRP price has now stayed above the Ichimoku conversion line and baseline for almost an entire year.
These two lines form the core trend indicators inside the Ichimoku system. Holding above both of them for this long is extremely uncommon and usually is a signal of strong trend momentum.
XRP briefly managed to reclaim these levels during the huge breakout in 2017 and fast rally in 2021, but never managed to build a base above them in a stable way until now. It wasn’t until after the November 2024 breakout that this structure really began to take shape as the XRP price finally reclaimed the $3 level for the first time since 2017.
Although the price of XRP briefly cooled off after touching $3.66 in July, it continued to hold above the conversion line and baseline throughout each pullback. Hughes says this kind of stability “shows how powerful XRP’s bull trend actually is,” especially because there is simply no historical example of XRP looking this strong on a multi-quarter chart.
What the XRP Chart Is Showing Right Now
The price of XRP is trading just beneath the $3 mark on the weekly chart and is sitting right below a pivotal resistance zone at $3.10.
That level has acted as a ceiling in the past, and traders expect it to play a major role again. Once price breaks above it, the chart begins to open up into a series of higher targets that have been discussed for months.
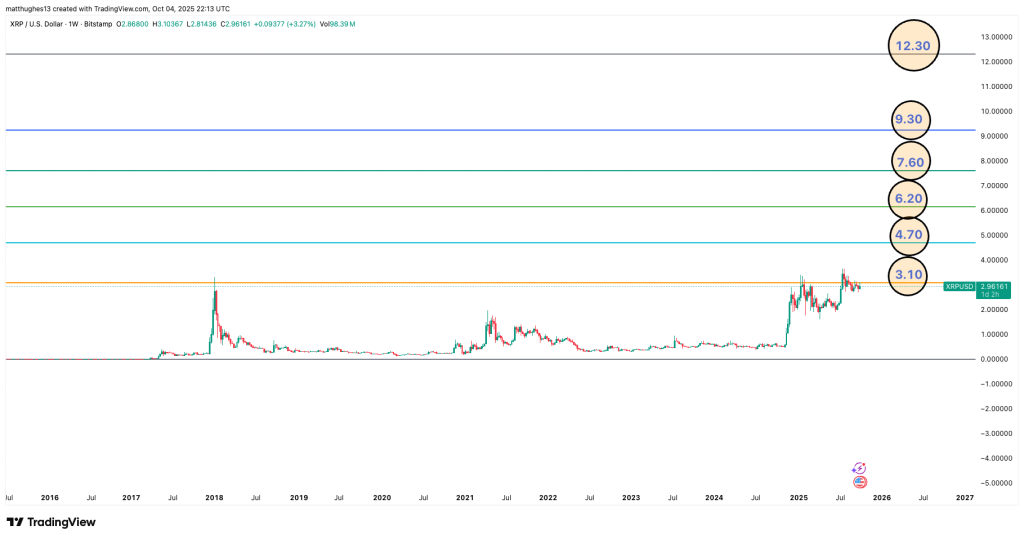
Hughes highlighted these zones earlier in the year, showing a sequence of Fib-based levels above the current range. In a previous post, he also pointed to the 1.27 Fibonacci extension at around $8.30 as a level the XRP price could reach if momentum accelerates the same way it did in earlier cycles.
Other analysts are seeing similar signs. Trader Cryptollica believes XRP is entering the final phase of a repeating four-phase pattern last seen between 2014 and 2018. If the pattern completes, he expects the move to stretch toward the double-digit area, with $10 being a realistic target based on past behavior.
Read Also: Top Crypto Catalysts to Watch This Week: XRP ETFs, Airdrops, Upgrades & CPI Data
What Could Push XRP Price Even Higher?
The technical picture is only one part of the story. Fundamentals around XRP and Ripple have been improving too.
The company has been pushing out new partnerships and acquisitions, each announcement adds another layer of confidence to the long-term outlook.
On top of that, the market is waiting to see what happens with the potential approval of U.S. spot XRP ETFs. That single event could bring in a completely new wave of demand, especially from institutional investors.
With the strongest multi-month structure XRP has ever shown now in place, the next phase of the trend may be starting to build. As long as the XRP price holds above the key Ichimoku lines, the door remains open for a move into the higher ranges on the chart.
Whether that means returning to the $4–$6 region or pushing even closer to $10, traders agree on one thing: XRP has not looked this strong in a very long time.
Subscribe to our YouTube channel for daily crypto updates, market insights, and expert analysis.