Legendary trader Peter Brandt, known for his decades of experience in classical charting, shared an intriguing observation about XRP’s long-term price structure, calling it “a purer long-term chart.” The post, accompanied by a multi-year XRP/USD chart, has quickly sparked debate among analysts and traders alike.
Even pro-Ripple lawyer Bill Morgan chimed in over Brandt’s post, writing: “I don’t know. I am not a chart guy, but lots of chart guys think it looks good. It’s not screaming sell now.”
Their exchange has reignited discussions around XRP’s massive symmetrical formation – a pattern that might be setting up for something significant.
Brandt’s chart covers nearly a decade of XRP price action, showing a remarkably consistent pattern of large converging triangles, each followed by an explosive breakout.
The first triangle, between 2014 and 2017, shows the XRP price consolidating before breaking out vertically from under $0.01 to over $3.00 – a gain of more than 30,000% at the time.
After that parabolic move, XRP entered another multi-year symmetrical triangle, forming lower highs and higher lows between 2018 and 2024. The structure finally broke upward in 2025, with the token pushing above $2.00 and stabilizing in a tight range between $2.50 and $2.80.
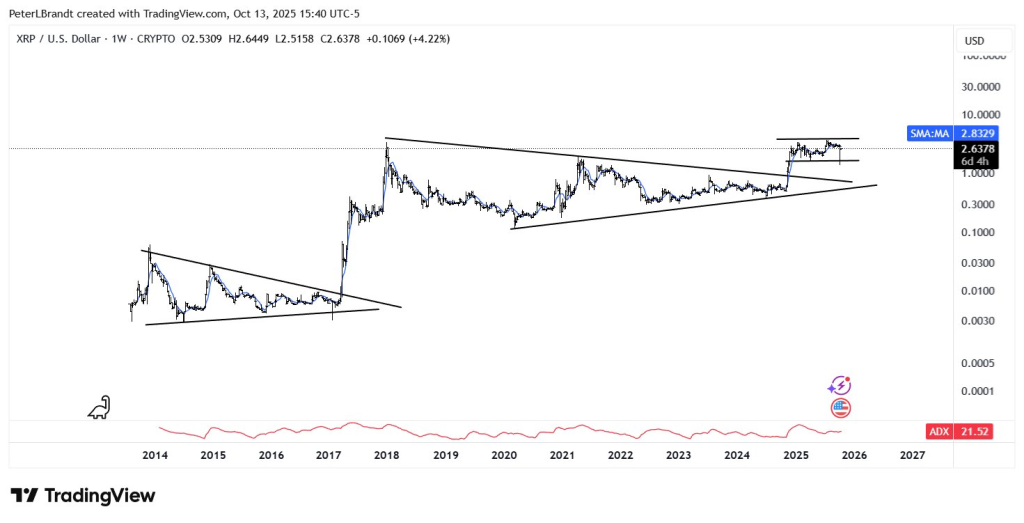
This current phase appears to be a horizontal consolidation channel, sitting just below the key resistance zone at $2.83.
What you'll learn 👉
XRP Chart: Support and Resistance Levels
The chart highlights a clean technical map for XRP:
- Immediate resistance: Around $2.83–$2.85, where XRP has repeatedly failed to close above on the weekly chart.
- First support zone: Between $2.20 and $2.40, which aligns with the breakout area from late September. This zone has held well so far and is attracting strong buying interest.
- Secondary support: Around $1.80–$2.00, a broader structural level that would still keep XRP within a healthy bullish setup if retested.
Anything below $1.80 would start to erode confidence and shift sentiment bearish, but as long as XRP holds above that level, the macro uptrend remains intact.
This structure indicates XRP is in a sideways accumulation phase, likely building strength for another major move.
Read also: Crypto Expert Calls XRP the ‘Greatest Asset’: Hype or Reality?
ADX Indicator: Calm Before the Storm
At the bottom of Brandt’s chart sits the Average Directional Index (ADX), shown as a red line hovering around 21.5. The ADX measures trend strength – and levels below 25 indicate a weak or consolidating trend.
In other words, volatility is currently subdued, and the market is waiting for direction. Historically, XRP’s major rallies (like in 2017 and 2021) started when the ADX bottomed and began rising again.
A rising ADX from this level would confirm renewed momentum – signaling the start of a new trend leg, potentially upward.
XRP Price Outlook and Prediction
Based on the current structure, the XRP price appears well-positioned for continuation if bulls can reclaim the $2.83 resistance area. A weekly close above that level could open the door to:
- $3.50–$4.00: The next major resistance zone and a key psychological target.
- $6.00: The projected move if XRP repeats its previous breakout strength.
- $10.00: A longer-term target derived from the measured move of the triangle pattern on the weekly chart.
If XRP drops below $2.20, short-term traders might take profits, but the higher-timeframe setup would remain valid until the $1.80 level breaks.
Overall, Peter Brandt’s comment that XRP’s chart is “pure” makes sense – it’s a clean example of classical compression and expansion. With volatility low, trend momentum cooling, and price coiling under major resistance, XRP may be in the final calm phase before its next decisive breakout.
Subscribe to our YouTube channel for daily crypto updates, market insights, and expert analysis.